Tongan vs Hopi 3 or more Vehicles in Household
COMPARE
Tongan
Hopi
3 or more Vehicles in Household
3 or more Vehicles in Household Comparison
Tongans
Hopi
26.5%
3 OR MORE VEHICLES IN HOUSEHOLD
100.0/ 100
METRIC RATING
3rd/ 347
METRIC RANK
18.2%
3 OR MORE VEHICLES IN HOUSEHOLD
2.5/ 100
METRIC RATING
242nd/ 347
METRIC RANK
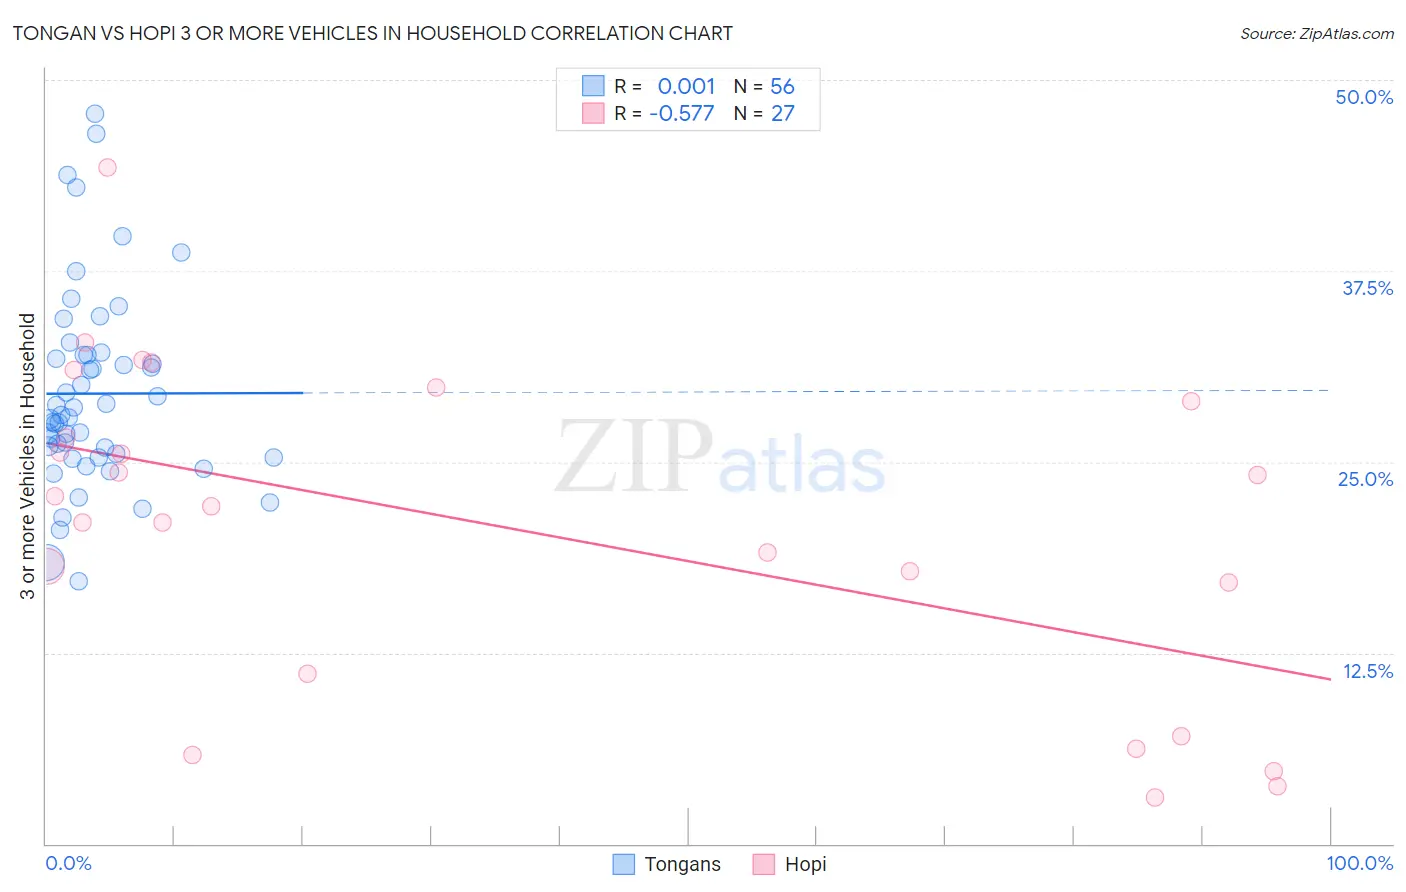
Tongan vs Hopi 3 or more Vehicles in Household Correlation Chart
The statistical analysis conducted on geographies consisting of 102,870,832 people shows no correlation between the proportion of Tongans and percentage of households with 3 or more vehicles available in the United States with a correlation coefficient (R) of 0.001 and weighted average of 26.5%. Similarly, the statistical analysis conducted on geographies consisting of 74,728,795 people shows a substantial negative correlation between the proportion of Hopi and percentage of households with 3 or more vehicles available in the United States with a correlation coefficient (R) of -0.577 and weighted average of 18.2%, a difference of 46.2%.
3 or more Vehicles in Household Correlation Summary
| Measurement | Tongan | Hopi |
| Minimum | 17.2% | 3.0% |
| Maximum | 47.8% | 44.3% |
| Range | 30.6% | 41.2% |
| Mean | 29.5% | 20.6% |
| Median | 28.0% | 22.1% |
| Interquartile 25% (IQ1) | 25.4% | 11.1% |
| Interquartile 75% (IQ3) | 32.0% | 29.0% |
| Interquartile Range (IQR) | 6.6% | 17.9% |
| Standard Deviation (Sample) | 6.4% | 10.6% |
| Standard Deviation (Population) | 6.4% | 10.4% |
Similar Demographics by 3 or more Vehicles in Household
Demographics Similar to Tongans by 3 or more Vehicles in Household
In terms of 3 or more vehicles in household, the demographic groups most similar to Tongans are Arapaho (26.4%, a difference of 0.33%), Puget Sound Salish (26.4%, a difference of 0.67%), Spanish American Indian (26.9%, a difference of 1.5%), Immigrants from Fiji (26.1%, a difference of 1.8%), and Colville (25.8%, a difference of 3.0%).
| Demographics | Rating | Rank | 3 or more Vehicles in Household |
| Yakama | 100.0 /100 | #1 | Exceptional 31.0% |
| Spanish American Indians | 100.0 /100 | #2 | Exceptional 26.9% |
| Tongans | 100.0 /100 | #3 | Exceptional 26.5% |
| Arapaho | 100.0 /100 | #4 | Exceptional 26.4% |
| Puget Sound Salish | 100.0 /100 | #5 | Exceptional 26.4% |
| Immigrants | Fiji | 100.0 /100 | #6 | Exceptional 26.1% |
| Colville | 100.0 /100 | #7 | Exceptional 25.8% |
| Samoans | 100.0 /100 | #8 | Exceptional 25.0% |
| Native Hawaiians | 100.0 /100 | #9 | Exceptional 24.9% |
| Nepalese | 100.0 /100 | #10 | Exceptional 24.9% |
| Shoshone | 100.0 /100 | #11 | Exceptional 24.9% |
| Danes | 100.0 /100 | #12 | Exceptional 24.7% |
| Mexicans | 100.0 /100 | #13 | Exceptional 24.7% |
| Immigrants | Mexico | 100.0 /100 | #14 | Exceptional 24.6% |
| Hawaiians | 100.0 /100 | #15 | Exceptional 24.3% |
Demographics Similar to Hopi by 3 or more Vehicles in Household
In terms of 3 or more vehicles in household, the demographic groups most similar to Hopi are African (18.2%, a difference of 0.11%), Immigrants from Europe (18.1%, a difference of 0.12%), Mongolian (18.1%, a difference of 0.24%), Immigrants from China (18.2%, a difference of 0.31%), and Immigrants from Belize (18.1%, a difference of 0.39%).
| Demographics | Rating | Rank | 3 or more Vehicles in Household |
| Sierra Leoneans | 3.9 /100 | #235 | Tragic 18.3% |
| Immigrants | Malaysia | 3.6 /100 | #236 | Tragic 18.3% |
| Indonesians | 3.5 /100 | #237 | Tragic 18.3% |
| Immigrants | Honduras | 3.1 /100 | #238 | Tragic 18.2% |
| Immigrants | Middle Africa | 3.1 /100 | #239 | Tragic 18.2% |
| Immigrants | China | 2.9 /100 | #240 | Tragic 18.2% |
| Africans | 2.7 /100 | #241 | Tragic 18.2% |
| Hopi | 2.5 /100 | #242 | Tragic 18.2% |
| Immigrants | Europe | 2.4 /100 | #243 | Tragic 18.1% |
| Mongolians | 2.3 /100 | #244 | Tragic 18.1% |
| Immigrants | Belize | 2.1 /100 | #245 | Tragic 18.1% |
| Immigrants | Australia | 2.0 /100 | #246 | Tragic 18.1% |
| Carpatho Rusyns | 1.9 /100 | #247 | Tragic 18.0% |
| Immigrants | Eastern Africa | 1.8 /100 | #248 | Tragic 18.0% |
| Immigrants | Saudi Arabia | 1.7 /100 | #249 | Tragic 18.0% |