Immigrants from Grenada vs Immigrants from Ukraine Unemployment Among Seniors over 75 years
COMPARE
Immigrants from Grenada
Immigrants from Ukraine
Unemployment Among Seniors over 75 years
Unemployment Among Seniors over 75 years Comparison
Immigrants from Grenada
Immigrants from Ukraine
6.7%
UNEMPLOYMENT AMONG SENIORS OVER 75 YEARS
100.0/ 100
METRIC RATING
11th/ 347
METRIC RANK
8.5%
UNEMPLOYMENT AMONG SENIORS OVER 75 YEARS
87.0/ 100
METRIC RATING
142nd/ 347
METRIC RANK
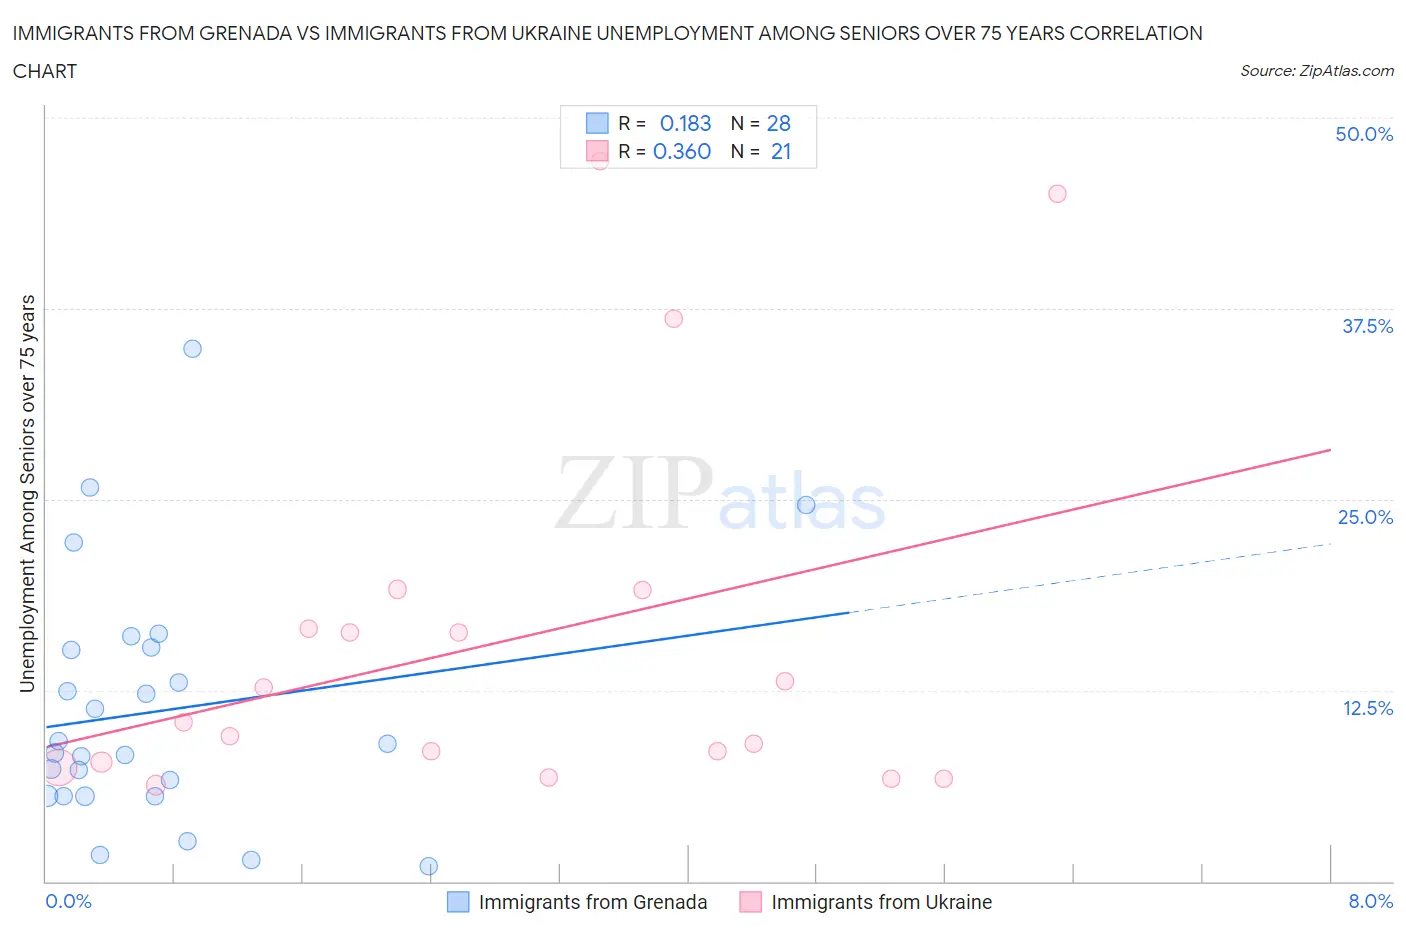
Immigrants from Grenada vs Immigrants from Ukraine Unemployment Among Seniors over 75 years Correlation Chart
The statistical analysis conducted on geographies consisting of 50,040,704 people shows a poor positive correlation between the proportion of Immigrants from Grenada and unemployment rate among seniors over the age of 75 in the United States with a correlation coefficient (R) of 0.183 and weighted average of 6.7%. Similarly, the statistical analysis conducted on geographies consisting of 165,762,931 people shows a mild positive correlation between the proportion of Immigrants from Ukraine and unemployment rate among seniors over the age of 75 in the United States with a correlation coefficient (R) of 0.360 and weighted average of 8.5%, a difference of 27.8%.
Unemployment Among Seniors over 75 years Correlation Summary
| Measurement | Immigrants from Grenada | Immigrants from Ukraine |
| Minimum | 1.0% | 6.3% |
| Maximum | 34.9% | 47.1% |
| Range | 33.9% | 40.8% |
| Mean | 11.2% | 15.7% |
| Median | 8.7% | 10.4% |
| Interquartile 25% (IQ1) | 5.6% | 7.6% |
| Interquartile 75% (IQ3) | 15.2% | 17.8% |
| Interquartile Range (IQR) | 9.6% | 10.2% |
| Standard Deviation (Sample) | 8.0% | 12.3% |
| Standard Deviation (Population) | 7.9% | 12.0% |
Similar Demographics by Unemployment Among Seniors over 75 years
Demographics Similar to Immigrants from Grenada by Unemployment Among Seniors over 75 years
In terms of unemployment among seniors over 75 years, the demographic groups most similar to Immigrants from Grenada are Yuman (6.7%, a difference of 0.10%), Comanche (6.7%, a difference of 0.14%), Soviet Union (6.6%, a difference of 0.31%), Immigrants from Congo (6.7%, a difference of 0.94%), and Taiwanese (6.6%, a difference of 1.6%).
| Demographics | Rating | Rank | Unemployment Among Seniors over 75 years |
| Alsatians | 100.0 /100 | #4 | Exceptional 6.1% |
| Hopi | 100.0 /100 | #5 | Exceptional 6.3% |
| Immigrants | Armenia | 100.0 /100 | #6 | Exceptional 6.5% |
| Spanish American Indians | 100.0 /100 | #7 | Exceptional 6.5% |
| Taiwanese | 100.0 /100 | #8 | Exceptional 6.6% |
| Soviet Union | 100.0 /100 | #9 | Exceptional 6.6% |
| Yuman | 100.0 /100 | #10 | Exceptional 6.7% |
| Immigrants | Grenada | 100.0 /100 | #11 | Exceptional 6.7% |
| Comanche | 100.0 /100 | #12 | Exceptional 6.7% |
| Immigrants | Congo | 100.0 /100 | #13 | Exceptional 6.7% |
| Ute | 100.0 /100 | #14 | Exceptional 6.8% |
| Icelanders | 100.0 /100 | #15 | Exceptional 7.0% |
| Seminole | 100.0 /100 | #16 | Exceptional 7.1% |
| Immigrants | Switzerland | 100.0 /100 | #17 | Exceptional 7.2% |
| Immigrants | Uzbekistan | 100.0 /100 | #18 | Exceptional 7.2% |
Demographics Similar to Immigrants from Ukraine by Unemployment Among Seniors over 75 years
In terms of unemployment among seniors over 75 years, the demographic groups most similar to Immigrants from Ukraine are Immigrants from Costa Rica (8.5%, a difference of 0.030%), Colombian (8.5%, a difference of 0.040%), Immigrants from Romania (8.5%, a difference of 0.090%), South American (8.5%, a difference of 0.11%), and Immigrants from Bolivia (8.5%, a difference of 0.11%).
| Demographics | Rating | Rank | Unemployment Among Seniors over 75 years |
| Haitians | 91.4 /100 | #135 | Exceptional 8.5% |
| Immigrants | Trinidad and Tobago | 90.8 /100 | #136 | Exceptional 8.5% |
| Immigrants | Kuwait | 90.5 /100 | #137 | Exceptional 8.5% |
| Immigrants | Bulgaria | 89.6 /100 | #138 | Excellent 8.5% |
| Barbadians | 88.6 /100 | #139 | Excellent 8.5% |
| South Americans | 87.9 /100 | #140 | Excellent 8.5% |
| Immigrants | Bolivia | 87.9 /100 | #141 | Excellent 8.5% |
| Immigrants | Ukraine | 87.0 /100 | #142 | Excellent 8.5% |
| Immigrants | Costa Rica | 86.8 /100 | #143 | Excellent 8.5% |
| Colombians | 86.7 /100 | #144 | Excellent 8.5% |
| Immigrants | Romania | 86.2 /100 | #145 | Excellent 8.5% |
| Immigrants | South Eastern Asia | 85.8 /100 | #146 | Excellent 8.5% |
| Immigrants | Sierra Leone | 85.6 /100 | #147 | Excellent 8.5% |
| Immigrants | Colombia | 85.6 /100 | #148 | Excellent 8.5% |
| Immigrants | Ecuador | 84.6 /100 | #149 | Excellent 8.5% |