Immigrants from Grenada vs Immigrants from Ukraine 10th Grade
COMPARE
Immigrants from Grenada
Immigrants from Ukraine
10th Grade
10th Grade Comparison
Immigrants from Grenada
Immigrants from Ukraine
91.6%
10TH GRADE
0.0/ 100
METRIC RATING
296th/ 347
METRIC RANK
94.0%
10TH GRADE
81.5/ 100
METRIC RATING
147th/ 347
METRIC RANK
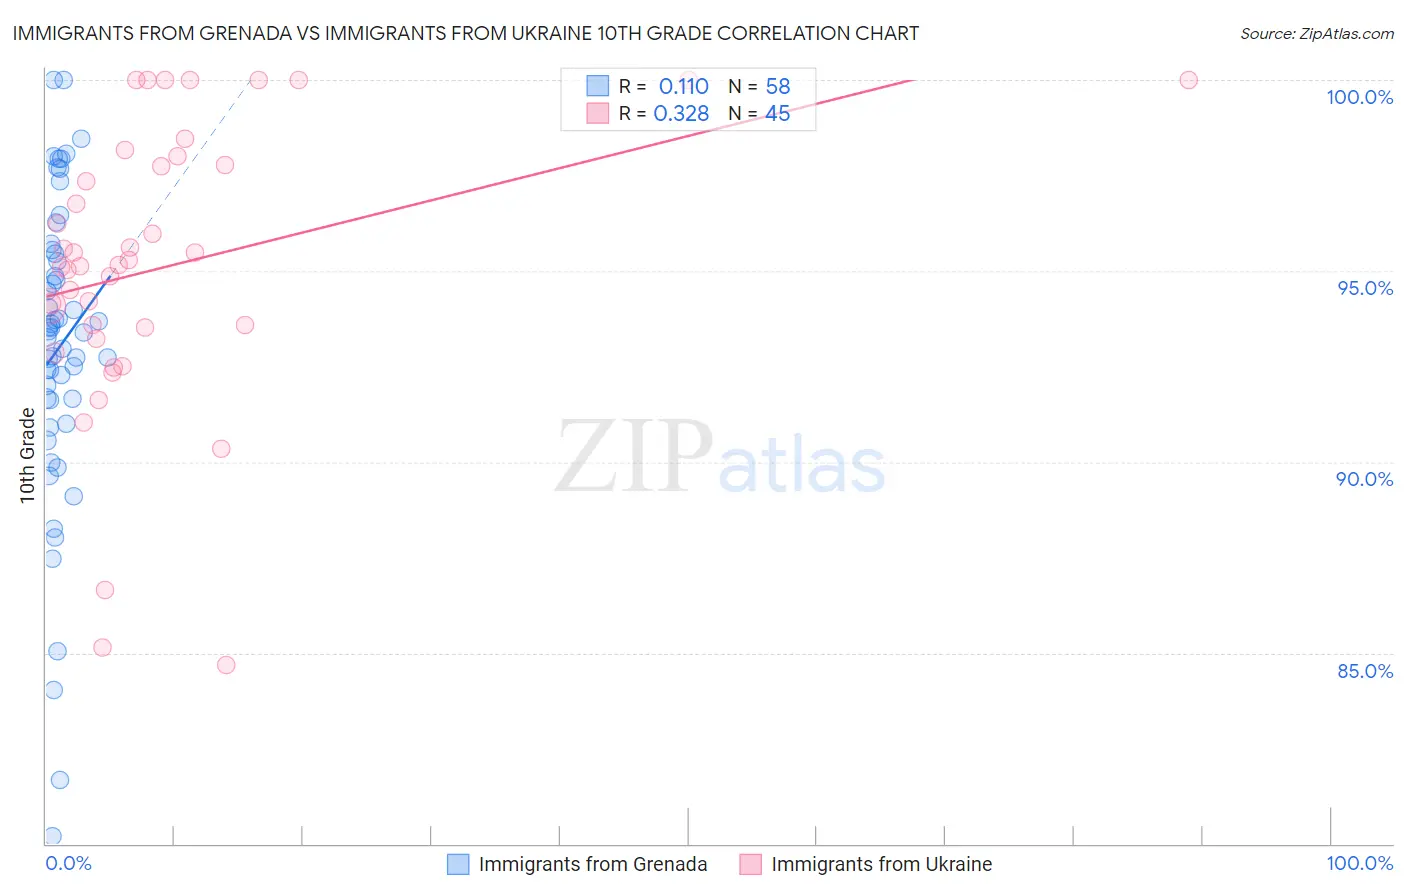
Immigrants from Grenada vs Immigrants from Ukraine 10th Grade Correlation Chart
The statistical analysis conducted on geographies consisting of 67,199,790 people shows a poor positive correlation between the proportion of Immigrants from Grenada and percentage of population with at least 10th grade education in the United States with a correlation coefficient (R) of 0.110 and weighted average of 91.6%. Similarly, the statistical analysis conducted on geographies consisting of 289,714,613 people shows a mild positive correlation between the proportion of Immigrants from Ukraine and percentage of population with at least 10th grade education in the United States with a correlation coefficient (R) of 0.328 and weighted average of 94.0%, a difference of 2.6%.
10th Grade Correlation Summary
| Measurement | Immigrants from Grenada | Immigrants from Ukraine |
| Minimum | 80.2% | 84.7% |
| Maximum | 100.0% | 100.0% |
| Range | 19.8% | 15.3% |
| Mean | 93.0% | 95.1% |
| Median | 93.4% | 95.2% |
| Interquartile 25% (IQ1) | 91.6% | 93.4% |
| Interquartile 75% (IQ3) | 95.4% | 97.9% |
| Interquartile Range (IQR) | 3.8% | 4.5% |
| Standard Deviation (Sample) | 4.1% | 3.7% |
| Standard Deviation (Population) | 4.0% | 3.7% |
Similar Demographics by 10th Grade
Demographics Similar to Immigrants from Grenada by 10th Grade
In terms of 10th grade, the demographic groups most similar to Immigrants from Grenada are Lumbee (91.7%, a difference of 0.13%), Fijian (91.5%, a difference of 0.14%), Haitian (91.8%, a difference of 0.15%), Cuban (91.5%, a difference of 0.17%), and Indonesian (91.8%, a difference of 0.19%).
| Demographics | Rating | Rank | 10th Grade |
| Sri Lankans | 0.0 /100 | #289 | Tragic 91.8% |
| British West Indians | 0.0 /100 | #290 | Tragic 91.8% |
| Immigrants | West Indies | 0.0 /100 | #291 | Tragic 91.8% |
| Immigrants | Burma/Myanmar | 0.0 /100 | #292 | Tragic 91.8% |
| Indonesians | 0.0 /100 | #293 | Tragic 91.8% |
| Haitians | 0.0 /100 | #294 | Tragic 91.8% |
| Lumbee | 0.0 /100 | #295 | Tragic 91.7% |
| Immigrants | Grenada | 0.0 /100 | #296 | Tragic 91.6% |
| Fijians | 0.0 /100 | #297 | Tragic 91.5% |
| Cubans | 0.0 /100 | #298 | Tragic 91.5% |
| Immigrants | Haiti | 0.0 /100 | #299 | Tragic 91.4% |
| Guyanese | 0.0 /100 | #300 | Tragic 91.4% |
| Japanese | 0.0 /100 | #301 | Tragic 91.2% |
| Immigrants | Guyana | 0.0 /100 | #302 | Tragic 91.2% |
| Immigrants | Vietnam | 0.0 /100 | #303 | Tragic 91.2% |
Demographics Similar to Immigrants from Ukraine by 10th Grade
In terms of 10th grade, the demographic groups most similar to Immigrants from Ukraine are Arab (94.0%, a difference of 0.010%), Ugandan (94.0%, a difference of 0.010%), Chickasaw (94.1%, a difference of 0.020%), Egyptian (94.0%, a difference of 0.030%), and Kenyan (94.0%, a difference of 0.030%).
| Demographics | Rating | Rank | 10th Grade |
| Immigrants | Jordan | 87.6 /100 | #140 | Excellent 94.1% |
| Hmong | 86.6 /100 | #141 | Excellent 94.1% |
| Albanians | 86.5 /100 | #142 | Excellent 94.1% |
| Cherokee | 84.9 /100 | #143 | Excellent 94.1% |
| Immigrants | Kazakhstan | 84.9 /100 | #144 | Excellent 94.1% |
| Immigrants | Nonimmigrants | 83.8 /100 | #145 | Excellent 94.1% |
| Chickasaw | 82.6 /100 | #146 | Excellent 94.1% |
| Immigrants | Ukraine | 81.5 /100 | #147 | Excellent 94.0% |
| Arabs | 80.9 /100 | #148 | Excellent 94.0% |
| Ugandans | 80.7 /100 | #149 | Excellent 94.0% |
| Egyptians | 79.6 /100 | #150 | Good 94.0% |
| Kenyans | 79.1 /100 | #151 | Good 94.0% |
| Immigrants | Italy | 78.0 /100 | #152 | Good 94.0% |
| Immigrants | Brazil | 75.5 /100 | #153 | Good 94.0% |
| Immigrants | Kenya | 75.3 /100 | #154 | Good 94.0% |