Immigrants from Ghana vs Basque Unemployment Among Ages 35 to 44 years
COMPARE
Immigrants from Ghana
Basque
Unemployment Among Ages 35 to 44 years
Unemployment Among Ages 35 to 44 years Comparison
Immigrants from Ghana
Basques
5.4%
UNEMPLOYMENT AMONG AGES 35 TO 44 YEARS
0.0/ 100
METRIC RATING
282nd/ 347
METRIC RANK
4.5%
UNEMPLOYMENT AMONG AGES 35 TO 44 YEARS
86.3/ 100
METRIC RATING
123rd/ 347
METRIC RANK
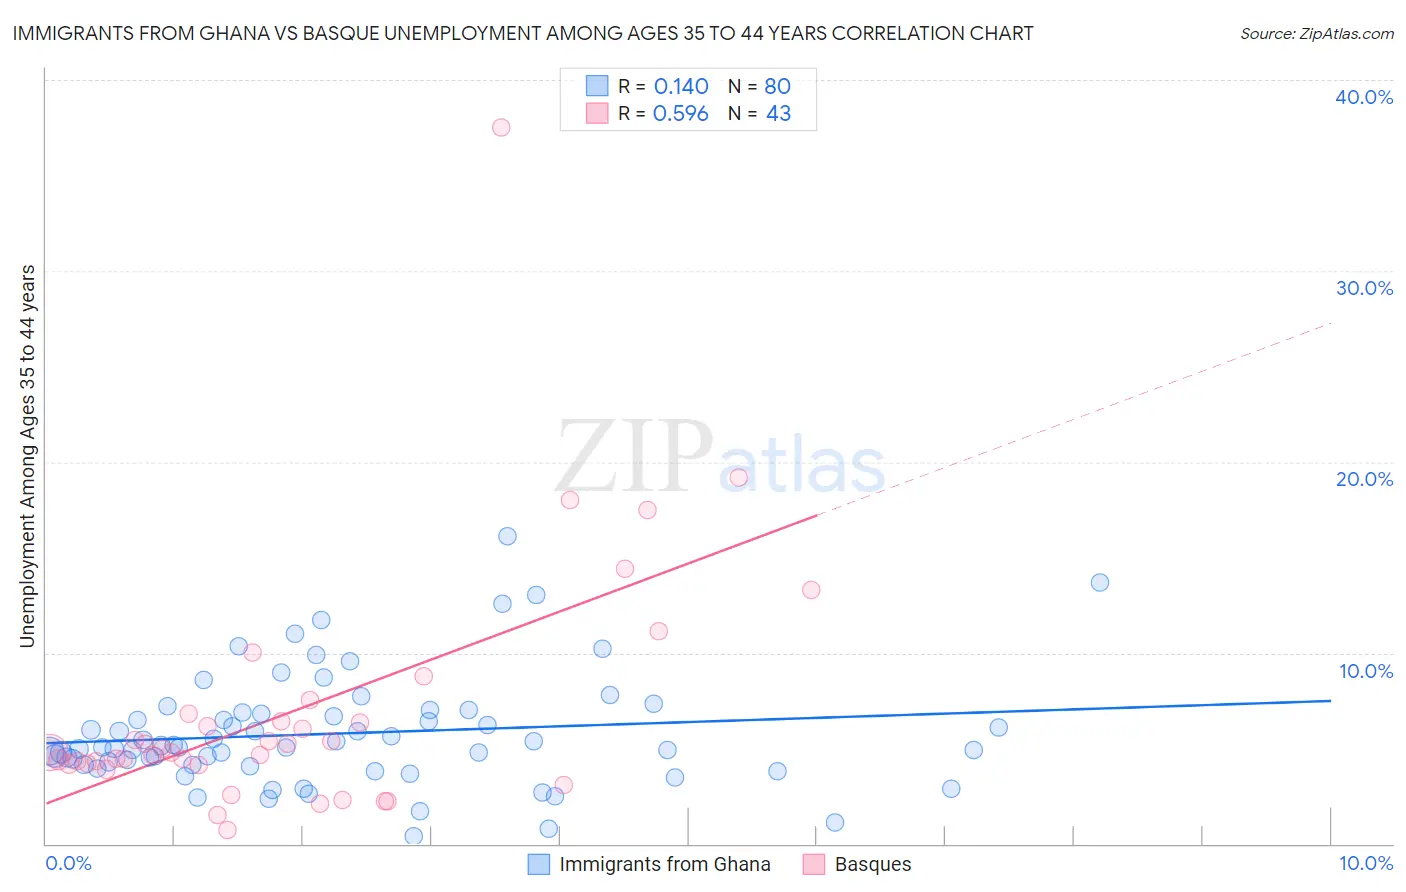
Immigrants from Ghana vs Basque Unemployment Among Ages 35 to 44 years Correlation Chart
The statistical analysis conducted on geographies consisting of 198,215,482 people shows a poor positive correlation between the proportion of Immigrants from Ghana and unemployment rate among population between the ages 35 and 44 in the United States with a correlation coefficient (R) of 0.140 and weighted average of 5.4%. Similarly, the statistical analysis conducted on geographies consisting of 164,256,495 people shows a substantial positive correlation between the proportion of Basques and unemployment rate among population between the ages 35 and 44 in the United States with a correlation coefficient (R) of 0.596 and weighted average of 4.5%, a difference of 19.4%.
Unemployment Among Ages 35 to 44 years Correlation Summary
| Measurement | Immigrants from Ghana | Basque |
| Minimum | 0.40% | 0.70% |
| Maximum | 16.1% | 37.5% |
| Range | 15.7% | 36.8% |
| Mean | 5.8% | 7.0% |
| Median | 5.0% | 4.8% |
| Interquartile 25% (IQ1) | 4.1% | 4.2% |
| Interquartile 75% (IQ3) | 6.8% | 6.8% |
| Interquartile Range (IQR) | 2.7% | 2.6% |
| Standard Deviation (Sample) | 2.9% | 6.4% |
| Standard Deviation (Population) | 2.9% | 6.4% |
Similar Demographics by Unemployment Among Ages 35 to 44 years
Demographics Similar to Immigrants from Ghana by Unemployment Among Ages 35 to 44 years
In terms of unemployment among ages 35 to 44 years, the demographic groups most similar to Immigrants from Ghana are Immigrants from Portugal (5.4%, a difference of 0.39%), Ecuadorian (5.4%, a difference of 0.43%), Immigrants from Senegal (5.4%, a difference of 0.60%), Immigrants from Ecuador (5.4%, a difference of 0.62%), and Lumbee (5.4%, a difference of 0.66%).
| Demographics | Rating | Rank | Unemployment Among Ages 35 to 44 years |
| Immigrants | Mexico | 0.0 /100 | #275 | Tragic 5.4% |
| Native Hawaiians | 0.0 /100 | #276 | Tragic 5.4% |
| Immigrants | Caribbean | 0.0 /100 | #277 | Tragic 5.4% |
| Lumbee | 0.0 /100 | #278 | Tragic 5.4% |
| Immigrants | Senegal | 0.0 /100 | #279 | Tragic 5.4% |
| Ecuadorians | 0.0 /100 | #280 | Tragic 5.4% |
| Immigrants | Portugal | 0.0 /100 | #281 | Tragic 5.4% |
| Immigrants | Ghana | 0.0 /100 | #282 | Tragic 5.4% |
| Immigrants | Ecuador | 0.0 /100 | #283 | Tragic 5.4% |
| Haitians | 0.0 /100 | #284 | Tragic 5.5% |
| Hispanics or Latinos | 0.0 /100 | #285 | Tragic 5.5% |
| Immigrants | Micronesia | 0.0 /100 | #286 | Tragic 5.5% |
| French American Indians | 0.0 /100 | #287 | Tragic 5.5% |
| Cree | 0.0 /100 | #288 | Tragic 5.5% |
| Spanish American Indians | 0.0 /100 | #289 | Tragic 5.5% |
Demographics Similar to Basques by Unemployment Among Ages 35 to 44 years
In terms of unemployment among ages 35 to 44 years, the demographic groups most similar to Basques are Immigrants from Spain (4.5%, a difference of 0.030%), Immigrants from Northern Africa (4.5%, a difference of 0.030%), Immigrants from South Africa (4.5%, a difference of 0.080%), Sri Lankan (4.5%, a difference of 0.080%), and Ethiopian (4.5%, a difference of 0.13%).
| Demographics | Rating | Rank | Unemployment Among Ages 35 to 44 years |
| Immigrants | Israel | 88.1 /100 | #116 | Excellent 4.5% |
| Immigrants | Greece | 87.9 /100 | #117 | Excellent 4.5% |
| Irish | 87.9 /100 | #118 | Excellent 4.5% |
| Nicaraguans | 87.6 /100 | #119 | Excellent 4.5% |
| Ethiopians | 87.1 /100 | #120 | Excellent 4.5% |
| Immigrants | South Africa | 86.8 /100 | #121 | Excellent 4.5% |
| Sri Lankans | 86.8 /100 | #122 | Excellent 4.5% |
| Basques | 86.3 /100 | #123 | Excellent 4.5% |
| Immigrants | Spain | 86.1 /100 | #124 | Excellent 4.5% |
| Immigrants | Northern Africa | 86.1 /100 | #125 | Excellent 4.5% |
| Immigrants | Austria | 84.7 /100 | #126 | Excellent 4.5% |
| Immigrants | Ethiopia | 84.7 /100 | #127 | Excellent 4.5% |
| Czechoslovakians | 83.4 /100 | #128 | Excellent 4.6% |
| Immigrants | Croatia | 83.1 /100 | #129 | Excellent 4.6% |
| Immigrants | Eritrea | 82.8 /100 | #130 | Excellent 4.6% |