Immigrants from Dominican Republic vs Immigrants from Thailand In Labor Force | Age 30-34
COMPARE
Immigrants from Dominican Republic
Immigrants from Thailand
In Labor Force | Age 30-34
In Labor Force | Age 30-34 Comparison
Immigrants from Dominican Republic
Immigrants from Thailand
83.8%
IN LABOR FORCE | AGE 30-34
0.3/ 100
METRIC RATING
260th/ 347
METRIC RANK
84.5%
IN LABOR FORCE | AGE 30-34
19.1/ 100
METRIC RATING
199th/ 347
METRIC RANK
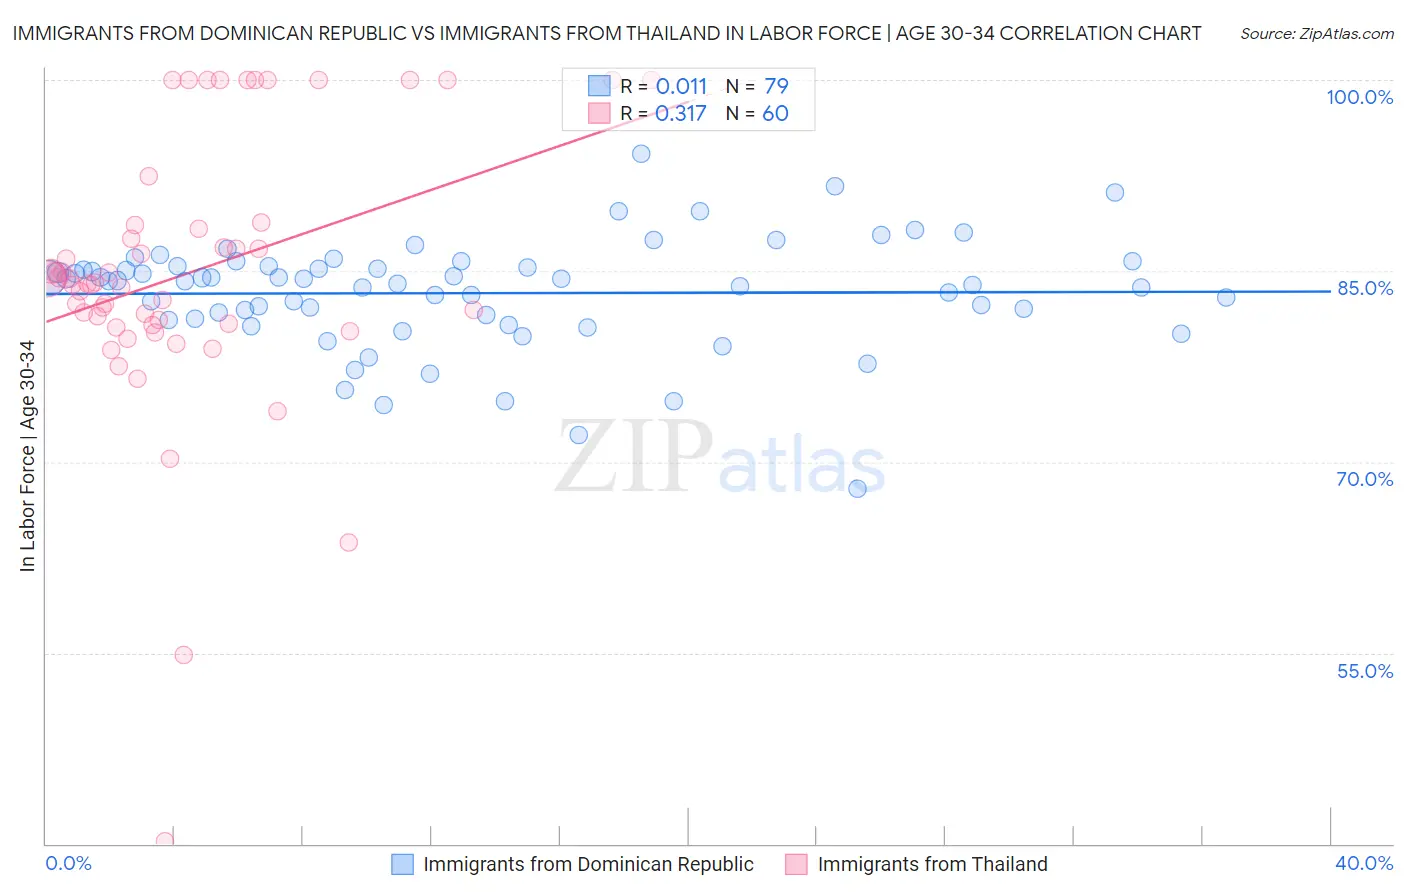
Immigrants from Dominican Republic vs Immigrants from Thailand In Labor Force | Age 30-34 Correlation Chart
The statistical analysis conducted on geographies consisting of 274,867,457 people shows no correlation between the proportion of Immigrants from Dominican Republic and labor force participation rate among population between the ages 30 and 34 in the United States with a correlation coefficient (R) of 0.011 and weighted average of 83.8%. Similarly, the statistical analysis conducted on geographies consisting of 316,924,245 people shows a mild positive correlation between the proportion of Immigrants from Thailand and labor force participation rate among population between the ages 30 and 34 in the United States with a correlation coefficient (R) of 0.317 and weighted average of 84.5%, a difference of 0.80%.
In Labor Force | Age 30-34 Correlation Summary
| Measurement | Immigrants from Dominican Republic | Immigrants from Thailand |
| Minimum | 67.9% | 40.2% |
| Maximum | 94.2% | 100.0% |
| Range | 26.3% | 59.8% |
| Mean | 83.3% | 84.8% |
| Median | 84.2% | 84.1% |
| Interquartile 25% (IQ1) | 81.2% | 80.8% |
| Interquartile 75% (IQ3) | 85.3% | 88.5% |
| Interquartile Range (IQR) | 4.1% | 7.6% |
| Standard Deviation (Sample) | 4.3% | 10.9% |
| Standard Deviation (Population) | 4.3% | 10.8% |
Similar Demographics by In Labor Force | Age 30-34
Demographics Similar to Immigrants from Dominican Republic by In Labor Force | Age 30-34
In terms of in labor force | age 30-34, the demographic groups most similar to Immigrants from Dominican Republic are Guyanese (83.8%, a difference of 0.010%), Honduran (83.8%, a difference of 0.020%), Scotch-Irish (83.8%, a difference of 0.020%), Dominican (83.8%, a difference of 0.020%), and Immigrants from Guyana (83.8%, a difference of 0.030%).
| Demographics | Rating | Rank | In Labor Force | Age 30-34 |
| Immigrants | Nicaragua | 0.6 /100 | #253 | Tragic 83.9% |
| Immigrants | St. Vincent and the Grenadines | 0.5 /100 | #254 | Tragic 83.9% |
| Whites/Caucasians | 0.5 /100 | #255 | Tragic 83.9% |
| Immigrants | Lebanon | 0.4 /100 | #256 | Tragic 83.9% |
| Iraqis | 0.3 /100 | #257 | Tragic 83.8% |
| Hondurans | 0.3 /100 | #258 | Tragic 83.8% |
| Scotch-Irish | 0.3 /100 | #259 | Tragic 83.8% |
| Immigrants | Dominican Republic | 0.3 /100 | #260 | Tragic 83.8% |
| Guyanese | 0.3 /100 | #261 | Tragic 83.8% |
| Dominicans | 0.2 /100 | #262 | Tragic 83.8% |
| Immigrants | Guyana | 0.2 /100 | #263 | Tragic 83.8% |
| Guatemalans | 0.2 /100 | #264 | Tragic 83.7% |
| Immigrants | Honduras | 0.1 /100 | #265 | Tragic 83.7% |
| Immigrants | Guatemala | 0.1 /100 | #266 | Tragic 83.7% |
| Spaniards | 0.1 /100 | #267 | Tragic 83.6% |
Demographics Similar to Immigrants from Thailand by In Labor Force | Age 30-34
In terms of in labor force | age 30-34, the demographic groups most similar to Immigrants from Thailand are Subsaharan African (84.5%, a difference of 0.0%), Dutch (84.5%, a difference of 0.010%), Trinidadian and Tobagonian (84.5%, a difference of 0.010%), Immigrants from West Indies (84.5%, a difference of 0.010%), and Immigrants from Syria (84.5%, a difference of 0.030%).
| Demographics | Rating | Rank | In Labor Force | Age 30-34 |
| Scandinavians | 24.7 /100 | #192 | Fair 84.5% |
| Immigrants | Costa Rica | 23.9 /100 | #193 | Fair 84.5% |
| Immigrants | Afghanistan | 23.5 /100 | #194 | Fair 84.5% |
| Koreans | 23.2 /100 | #195 | Fair 84.5% |
| British | 22.9 /100 | #196 | Fair 84.5% |
| Immigrants | Syria | 21.9 /100 | #197 | Fair 84.5% |
| Dutch | 20.2 /100 | #198 | Fair 84.5% |
| Immigrants | Thailand | 19.1 /100 | #199 | Poor 84.5% |
| Sub-Saharan Africans | 19.0 /100 | #200 | Poor 84.5% |
| Trinidadians and Tobagonians | 18.2 /100 | #201 | Poor 84.5% |
| Immigrants | West Indies | 18.1 /100 | #202 | Poor 84.5% |
| Canadians | 15.4 /100 | #203 | Poor 84.4% |
| Ecuadorians | 14.2 /100 | #204 | Poor 84.4% |
| French | 13.8 /100 | #205 | Poor 84.4% |
| Lebanese | 10.6 /100 | #206 | Poor 84.4% |