Immigrants from Czechoslovakia vs Carpatho Rusyn Disability Age Under 5
COMPARE
Immigrants from Czechoslovakia
Carpatho Rusyn
Disability Age Under 5
Disability Age Under 5 Comparison
Immigrants from Czechoslovakia
Carpatho Rusyns
1.2%
DISABILITY AGE UNDER 5
82.8/ 100
METRIC RATING
138th/ 347
METRIC RANK
1.4%
DISABILITY AGE UNDER 5
0.1/ 100
METRIC RATING
265th/ 347
METRIC RANK
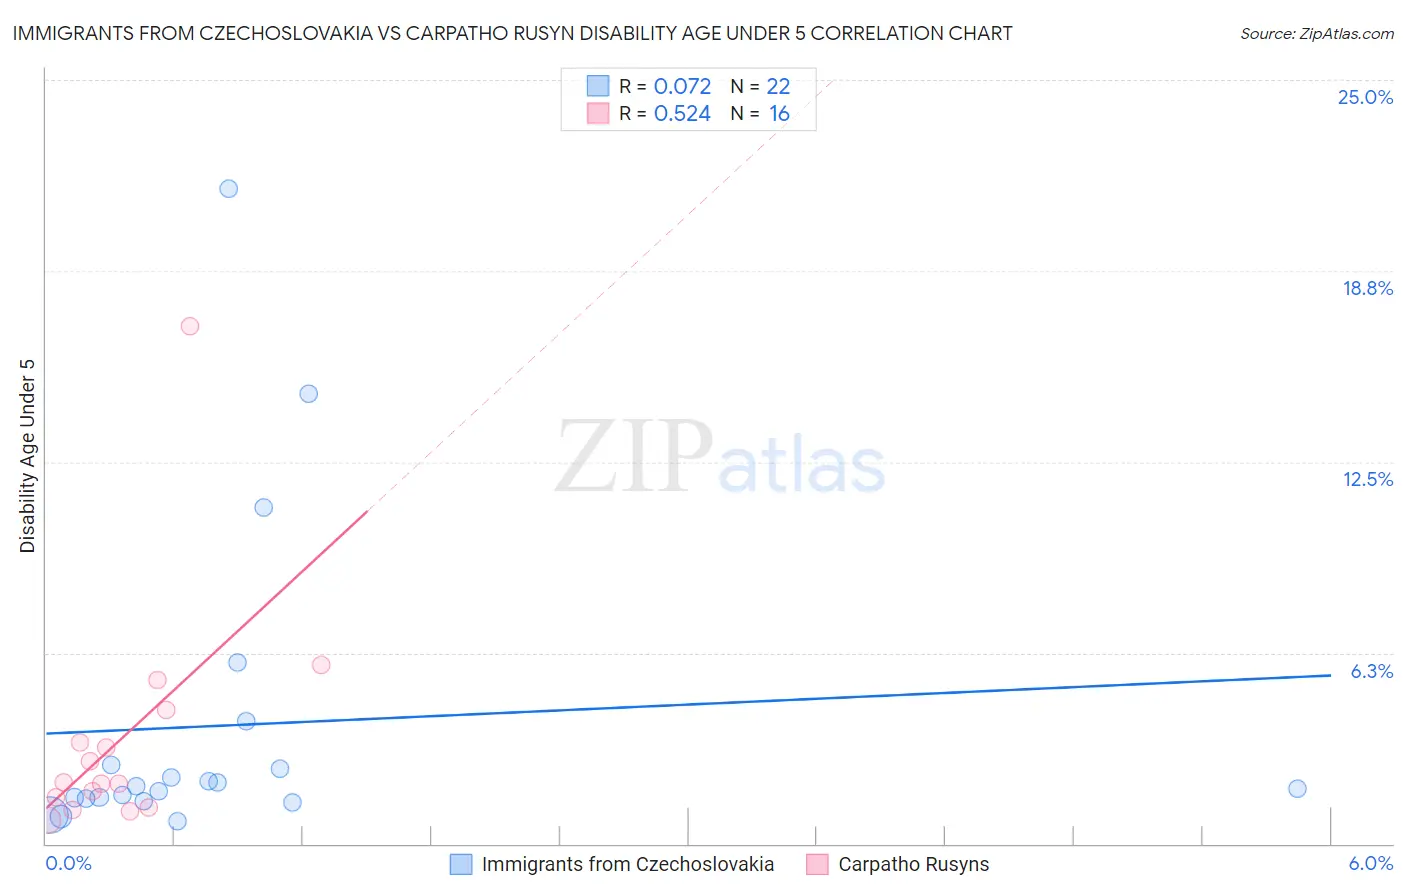
Immigrants from Czechoslovakia vs Carpatho Rusyn Disability Age Under 5 Correlation Chart
The statistical analysis conducted on geographies consisting of 125,406,021 people shows a slight positive correlation between the proportion of Immigrants from Czechoslovakia and percentage of population with a disability under the age of 5 in the United States with a correlation coefficient (R) of 0.072 and weighted average of 1.2%. Similarly, the statistical analysis conducted on geographies consisting of 46,602,246 people shows a substantial positive correlation between the proportion of Carpatho Rusyns and percentage of population with a disability under the age of 5 in the United States with a correlation coefficient (R) of 0.524 and weighted average of 1.4%, a difference of 19.0%.
Disability Age Under 5 Correlation Summary
| Measurement | Immigrants from Czechoslovakia | Carpatho Rusyn |
| Minimum | 0.72% | 0.78% |
| Maximum | 21.4% | 16.9% |
| Range | 20.7% | 16.2% |
| Mean | 3.9% | 3.4% |
| Median | 1.8% | 2.0% |
| Interquartile 25% (IQ1) | 1.5% | 1.3% |
| Interquartile 75% (IQ3) | 2.6% | 3.8% |
| Interquartile Range (IQR) | 1.1% | 2.5% |
| Standard Deviation (Sample) | 5.2% | 3.9% |
| Standard Deviation (Population) | 5.1% | 3.8% |
Similar Demographics by Disability Age Under 5
Demographics Similar to Immigrants from Czechoslovakia by Disability Age Under 5
In terms of disability age under 5, the demographic groups most similar to Immigrants from Czechoslovakia are Immigrants from Eastern Africa (1.2%, a difference of 0.050%), Moroccan (1.2%, a difference of 0.14%), New Zealander (1.2%, a difference of 0.23%), Fijian (1.2%, a difference of 0.32%), and Somali (1.2%, a difference of 0.32%).
| Demographics | Rating | Rank | Disability Age Under 5 |
| Immigrants | Serbia | 87.6 /100 | #131 | Excellent 1.2% |
| Immigrants | Eastern Europe | 87.3 /100 | #132 | Excellent 1.2% |
| Immigrants | Spain | 86.5 /100 | #133 | Excellent 1.2% |
| Argentineans | 85.7 /100 | #134 | Excellent 1.2% |
| Fijians | 84.7 /100 | #135 | Excellent 1.2% |
| Moroccans | 83.6 /100 | #136 | Excellent 1.2% |
| Immigrants | Eastern Africa | 83.1 /100 | #137 | Excellent 1.2% |
| Immigrants | Czechoslovakia | 82.8 /100 | #138 | Excellent 1.2% |
| New Zealanders | 81.4 /100 | #139 | Excellent 1.2% |
| Somalis | 80.8 /100 | #140 | Excellent 1.2% |
| Immigrants | Honduras | 80.4 /100 | #141 | Excellent 1.2% |
| Immigrants | Colombia | 79.3 /100 | #142 | Good 1.2% |
| Alsatians | 79.3 /100 | #143 | Good 1.2% |
| Immigrants | Middle Africa | 79.3 /100 | #144 | Good 1.2% |
| Immigrants | Zimbabwe | 77.9 /100 | #145 | Good 1.2% |
Demographics Similar to Carpatho Rusyns by Disability Age Under 5
In terms of disability age under 5, the demographic groups most similar to Carpatho Rusyns are Immigrants from Germany (1.4%, a difference of 0.030%), Yugoslavian (1.4%, a difference of 0.040%), Spanish (1.4%, a difference of 0.19%), Immigrants from Dominica (1.4%, a difference of 0.25%), and Immigrants from Netherlands (1.4%, a difference of 0.41%).
| Demographics | Rating | Rank | Disability Age Under 5 |
| Costa Ricans | 0.3 /100 | #258 | Tragic 1.4% |
| Immigrants | Southern Europe | 0.3 /100 | #259 | Tragic 1.4% |
| Slavs | 0.3 /100 | #260 | Tragic 1.4% |
| Immigrants | Netherlands | 0.2 /100 | #261 | Tragic 1.4% |
| Immigrants | Dominica | 0.2 /100 | #262 | Tragic 1.4% |
| Spanish | 0.2 /100 | #263 | Tragic 1.4% |
| Yugoslavians | 0.1 /100 | #264 | Tragic 1.4% |
| Carpatho Rusyns | 0.1 /100 | #265 | Tragic 1.4% |
| Immigrants | Germany | 0.1 /100 | #266 | Tragic 1.4% |
| Cree | 0.1 /100 | #267 | Tragic 1.4% |
| Belgians | 0.1 /100 | #268 | Tragic 1.4% |
| Austrians | 0.1 /100 | #269 | Tragic 1.4% |
| Immigrants | North America | 0.1 /100 | #270 | Tragic 1.4% |
| Immigrants | Canada | 0.1 /100 | #271 | Tragic 1.4% |
| Blacks/African Americans | 0.1 /100 | #272 | Tragic 1.4% |