Immigrants from Czechoslovakia vs Immigrants from Kazakhstan 1 or more Vehicles in Household
COMPARE
Immigrants from Czechoslovakia
Immigrants from Kazakhstan
1 or more Vehicles in Household
1 or more Vehicles in Household Comparison
Immigrants from Czechoslovakia
Immigrants from Kazakhstan
88.3%
1 OR MORE VEHICLES IN HOUSEHOLD
1.9/ 100
METRIC RATING
245th/ 347
METRIC RANK
86.6%
1 OR MORE VEHICLES IN HOUSEHOLD
0.0/ 100
METRIC RATING
285th/ 347
METRIC RANK
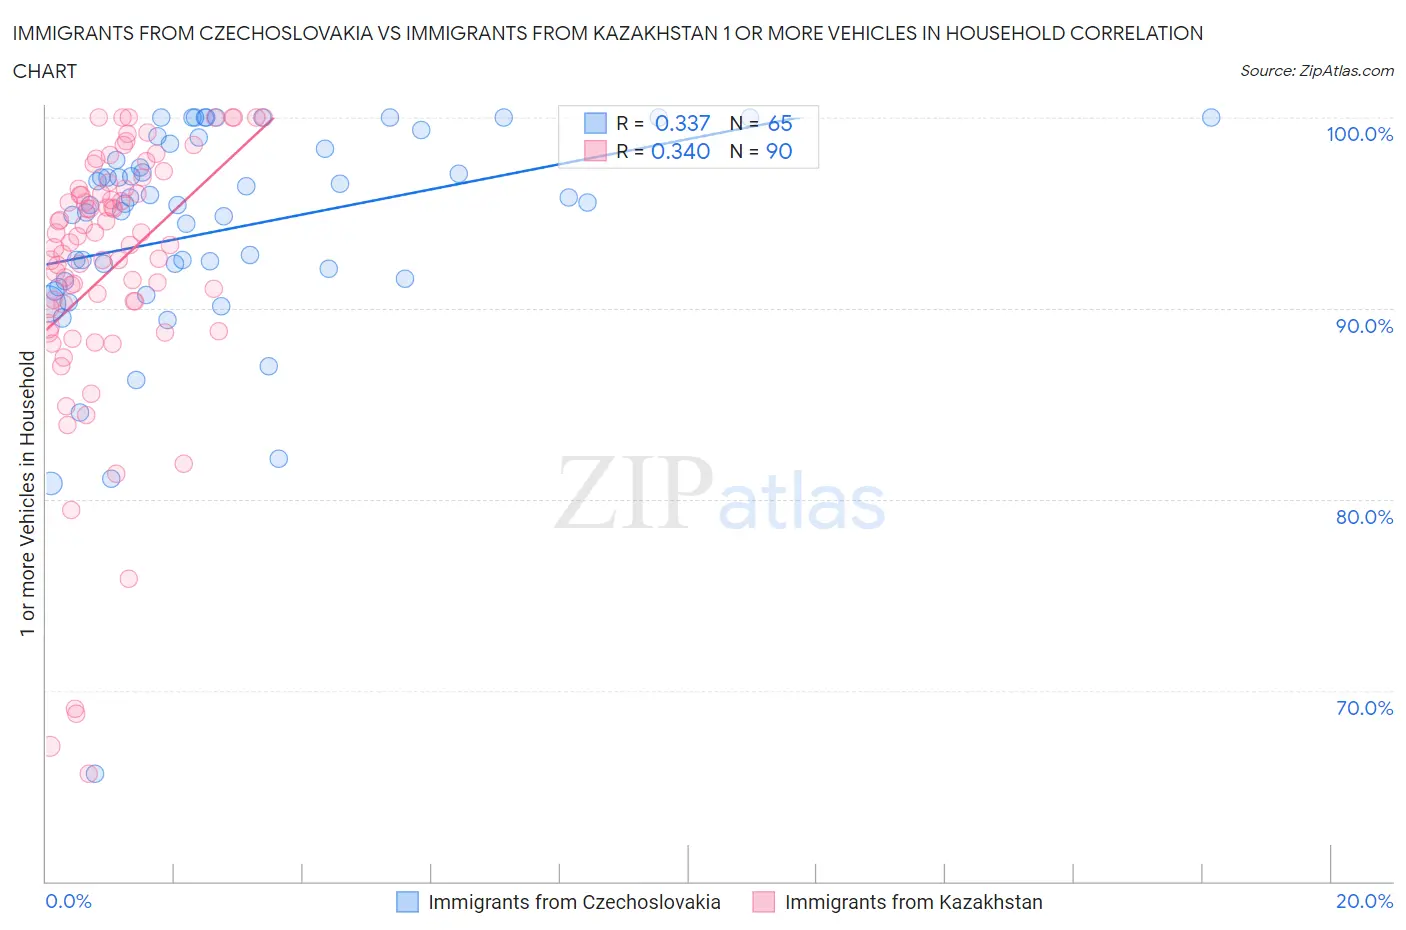
Immigrants from Czechoslovakia vs Immigrants from Kazakhstan 1 or more Vehicles in Household Correlation Chart
The statistical analysis conducted on geographies consisting of 195,451,369 people shows a mild positive correlation between the proportion of Immigrants from Czechoslovakia and percentage of households with 1 or more vehicles available in the United States with a correlation coefficient (R) of 0.337 and weighted average of 88.3%. Similarly, the statistical analysis conducted on geographies consisting of 124,327,848 people shows a mild positive correlation between the proportion of Immigrants from Kazakhstan and percentage of households with 1 or more vehicles available in the United States with a correlation coefficient (R) of 0.340 and weighted average of 86.6%, a difference of 2.0%.
1 or more Vehicles in Household Correlation Summary
| Measurement | Immigrants from Czechoslovakia | Immigrants from Kazakhstan |
| Minimum | 65.6% | 65.6% |
| Maximum | 100.0% | 100.0% |
| Range | 34.4% | 34.4% |
| Mean | 94.1% | 92.0% |
| Median | 95.5% | 93.4% |
| Interquartile 25% (IQ1) | 91.5% | 90.0% |
| Interquartile 75% (IQ3) | 98.5% | 96.3% |
| Interquartile Range (IQR) | 7.0% | 6.2% |
| Standard Deviation (Sample) | 6.0% | 7.2% |
| Standard Deviation (Population) | 5.9% | 7.2% |
Similar Demographics by 1 or more Vehicles in Household
Demographics Similar to Immigrants from Czechoslovakia by 1 or more Vehicles in Household
In terms of 1 or more vehicles in household, the demographic groups most similar to Immigrants from Czechoslovakia are Immigrants from Portugal (88.3%, a difference of 0.010%), Menominee (88.3%, a difference of 0.010%), Immigrants from Belgium (88.4%, a difference of 0.040%), Immigrants from Honduras (88.3%, a difference of 0.050%), and Immigrants from Nigeria (88.2%, a difference of 0.090%).
| Demographics | Rating | Rank | 1 or more Vehicles in Household |
| Immigrants | Somalia | 4.2 /100 | #238 | Tragic 88.6% |
| Kiowa | 3.8 /100 | #239 | Tragic 88.6% |
| Eastern Europeans | 3.0 /100 | #240 | Tragic 88.5% |
| Taiwanese | 2.6 /100 | #241 | Tragic 88.4% |
| Turks | 2.5 /100 | #242 | Tragic 88.4% |
| Immigrants | Belgium | 2.1 /100 | #243 | Tragic 88.4% |
| Immigrants | Portugal | 2.0 /100 | #244 | Tragic 88.3% |
| Immigrants | Czechoslovakia | 1.9 /100 | #245 | Tragic 88.3% |
| Menominee | 1.9 /100 | #246 | Tragic 88.3% |
| Immigrants | Honduras | 1.7 /100 | #247 | Tragic 88.3% |
| Immigrants | Nigeria | 1.5 /100 | #248 | Tragic 88.2% |
| Blacks/African Americans | 1.4 /100 | #249 | Tragic 88.2% |
| Egyptians | 1.2 /100 | #250 | Tragic 88.2% |
| Immigrants | Serbia | 1.2 /100 | #251 | Tragic 88.2% |
| Immigrants | Uruguay | 1.1 /100 | #252 | Tragic 88.1% |
Demographics Similar to Immigrants from Kazakhstan by 1 or more Vehicles in Household
In terms of 1 or more vehicles in household, the demographic groups most similar to Immigrants from Kazakhstan are Immigrants from Eastern Asia (86.5%, a difference of 0.030%), Immigrants from Malaysia (86.5%, a difference of 0.11%), Hopi (86.4%, a difference of 0.18%), Central American Indian (86.7%, a difference of 0.20%), and Immigrants from Ireland (86.4%, a difference of 0.20%).
| Demographics | Rating | Rank | 1 or more Vehicles in Household |
| Immigrants | Southern Europe | 0.1 /100 | #278 | Tragic 87.1% |
| Immigrants | Albania | 0.1 /100 | #279 | Tragic 87.1% |
| Immigrants | Croatia | 0.0 /100 | #280 | Tragic 87.0% |
| Mongolians | 0.0 /100 | #281 | Tragic 87.0% |
| Colville | 0.0 /100 | #282 | Tragic 86.8% |
| Immigrants | Eastern Europe | 0.0 /100 | #283 | Tragic 86.7% |
| Central American Indians | 0.0 /100 | #284 | Tragic 86.7% |
| Immigrants | Kazakhstan | 0.0 /100 | #285 | Tragic 86.6% |
| Immigrants | Eastern Asia | 0.0 /100 | #286 | Tragic 86.5% |
| Immigrants | Malaysia | 0.0 /100 | #287 | Tragic 86.5% |
| Hopi | 0.0 /100 | #288 | Tragic 86.4% |
| Immigrants | Ireland | 0.0 /100 | #289 | Tragic 86.4% |
| Immigrants | Australia | 0.0 /100 | #290 | Tragic 86.4% |
| Pima | 0.0 /100 | #291 | Tragic 86.3% |
| Okinawans | 0.0 /100 | #292 | Tragic 86.1% |