Immigrants from Czechoslovakia vs Australian No Vehicles in Household
COMPARE
Immigrants from Czechoslovakia
Australian
No Vehicles in Household
No Vehicles in Household Comparison
Immigrants from Czechoslovakia
Australians
11.8%
NO VEHICLES IN HOUSEHOLD
2.0/ 100
METRIC RATING
247th/ 347
METRIC RANK
10.1%
NO VEHICLES IN HOUSEHOLD
70.6/ 100
METRIC RATING
157th/ 347
METRIC RANK
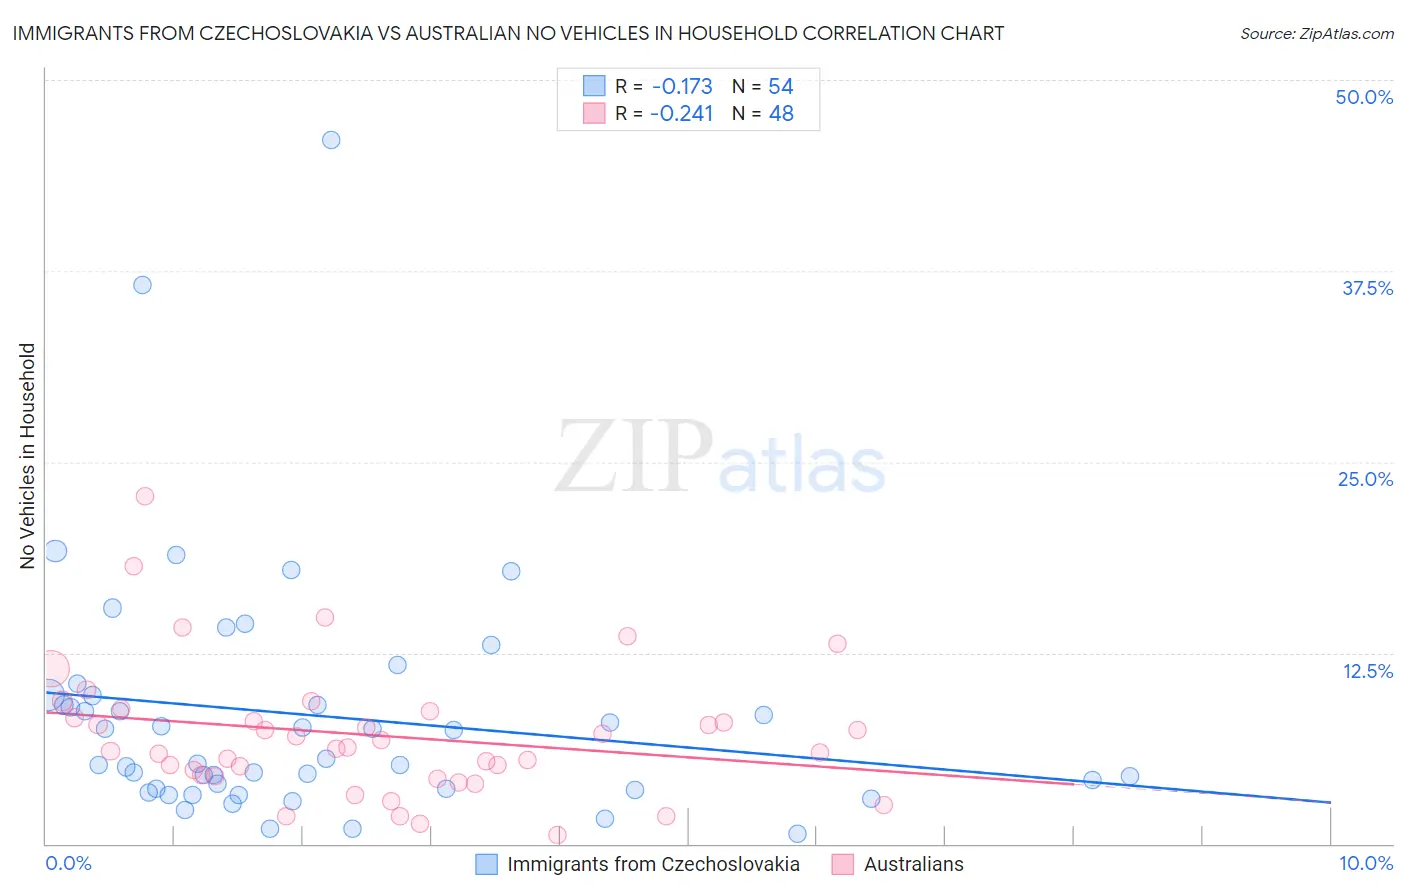
Immigrants from Czechoslovakia vs Australian No Vehicles in Household Correlation Chart
The statistical analysis conducted on geographies consisting of 195,341,249 people shows a poor negative correlation between the proportion of Immigrants from Czechoslovakia and percentage of households with no vehicle available in the United States with a correlation coefficient (R) of -0.173 and weighted average of 11.8%. Similarly, the statistical analysis conducted on geographies consisting of 223,715,583 people shows a weak negative correlation between the proportion of Australians and percentage of households with no vehicle available in the United States with a correlation coefficient (R) of -0.241 and weighted average of 10.1%, a difference of 16.7%.
No Vehicles in Household Correlation Summary
| Measurement | Immigrants from Czechoslovakia | Australian |
| Minimum | 0.65% | 0.57% |
| Maximum | 46.0% | 22.8% |
| Range | 45.4% | 22.2% |
| Mean | 8.4% | 7.1% |
| Median | 5.4% | 6.3% |
| Interquartile 25% (IQ1) | 3.6% | 4.5% |
| Interquartile 75% (IQ3) | 9.7% | 8.5% |
| Interquartile Range (IQR) | 6.1% | 4.0% |
| Standard Deviation (Sample) | 8.1% | 4.4% |
| Standard Deviation (Population) | 8.0% | 4.3% |
Similar Demographics by No Vehicles in Household
Demographics Similar to Immigrants from Czechoslovakia by No Vehicles in Household
In terms of no vehicles in household, the demographic groups most similar to Immigrants from Czechoslovakia are Immigrants from Belgium (11.8%, a difference of 0.010%), Immigrants from Nigeria (11.8%, a difference of 0.040%), Menominee (11.8%, a difference of 0.050%), Immigrants from Honduras (11.8%, a difference of 0.22%), and Paiute (11.8%, a difference of 0.26%).
| Demographics | Rating | Rank | No Vehicles in Household |
| Immigrants | Immigrants | 2.7 /100 | #240 | Tragic 11.7% |
| Eastern Europeans | 2.7 /100 | #241 | Tragic 11.7% |
| Turks | 2.6 /100 | #242 | Tragic 11.7% |
| Cheyenne | 2.4 /100 | #243 | Tragic 11.7% |
| Immigrants | Portugal | 2.2 /100 | #244 | Tragic 11.7% |
| Immigrants | Honduras | 2.1 /100 | #245 | Tragic 11.8% |
| Menominee | 2.0 /100 | #246 | Tragic 11.8% |
| Immigrants | Czechoslovakia | 2.0 /100 | #247 | Tragic 11.8% |
| Immigrants | Belgium | 1.9 /100 | #248 | Tragic 11.8% |
| Immigrants | Nigeria | 1.9 /100 | #249 | Tragic 11.8% |
| Paiute | 1.8 /100 | #250 | Tragic 11.8% |
| Blacks/African Americans | 1.6 /100 | #251 | Tragic 11.9% |
| Immigrants | Serbia | 1.5 /100 | #252 | Tragic 11.9% |
| Egyptians | 1.4 /100 | #253 | Tragic 11.9% |
| Immigrants | Uruguay | 1.3 /100 | #254 | Tragic 11.9% |
Demographics Similar to Australians by No Vehicles in Household
In terms of no vehicles in household, the demographic groups most similar to Australians are Immigrants from Micronesia (10.1%, a difference of 0.050%), Spanish American Indian (10.1%, a difference of 0.060%), Immigrants from Indonesia (10.1%, a difference of 0.21%), Salvadoran (10.1%, a difference of 0.30%), and Sioux (10.1%, a difference of 0.31%).
| Demographics | Rating | Rank | No Vehicles in Household |
| Colombians | 73.9 /100 | #150 | Good 10.0% |
| Immigrants | Eastern Africa | 73.8 /100 | #151 | Good 10.0% |
| Immigrants | Congo | 73.0 /100 | #152 | Good 10.1% |
| Tlingit-Haida | 72.5 /100 | #153 | Good 10.1% |
| Sioux | 72.4 /100 | #154 | Good 10.1% |
| Salvadorans | 72.4 /100 | #155 | Good 10.1% |
| Immigrants | Micronesia | 70.9 /100 | #156 | Good 10.1% |
| Australians | 70.6 /100 | #157 | Good 10.1% |
| Spanish American Indians | 70.2 /100 | #158 | Good 10.1% |
| Immigrants | Indonesia | 69.3 /100 | #159 | Good 10.1% |
| Immigrants | Middle Africa | 65.7 /100 | #160 | Good 10.2% |
| New Zealanders | 65.1 /100 | #161 | Good 10.2% |
| Immigrants | Austria | 64.4 /100 | #162 | Good 10.2% |
| Immigrants | Cambodia | 63.7 /100 | #163 | Good 10.2% |
| South Africans | 61.1 /100 | #164 | Good 10.2% |