Immigrants from Czechoslovakia vs Australian Child Poverty Under the Age of 5
COMPARE
Immigrants from Czechoslovakia
Australian
Child Poverty Under the Age of 5
Child Poverty Under the Age of 5 Comparison
Immigrants from Czechoslovakia
Australians
14.8%
CHILD POVERTY UNDER THE AGE OF 5
99.6/ 100
METRIC RATING
48th/ 347
METRIC RANK
15.5%
CHILD POVERTY UNDER THE AGE OF 5
98.0/ 100
METRIC RATING
79th/ 347
METRIC RANK
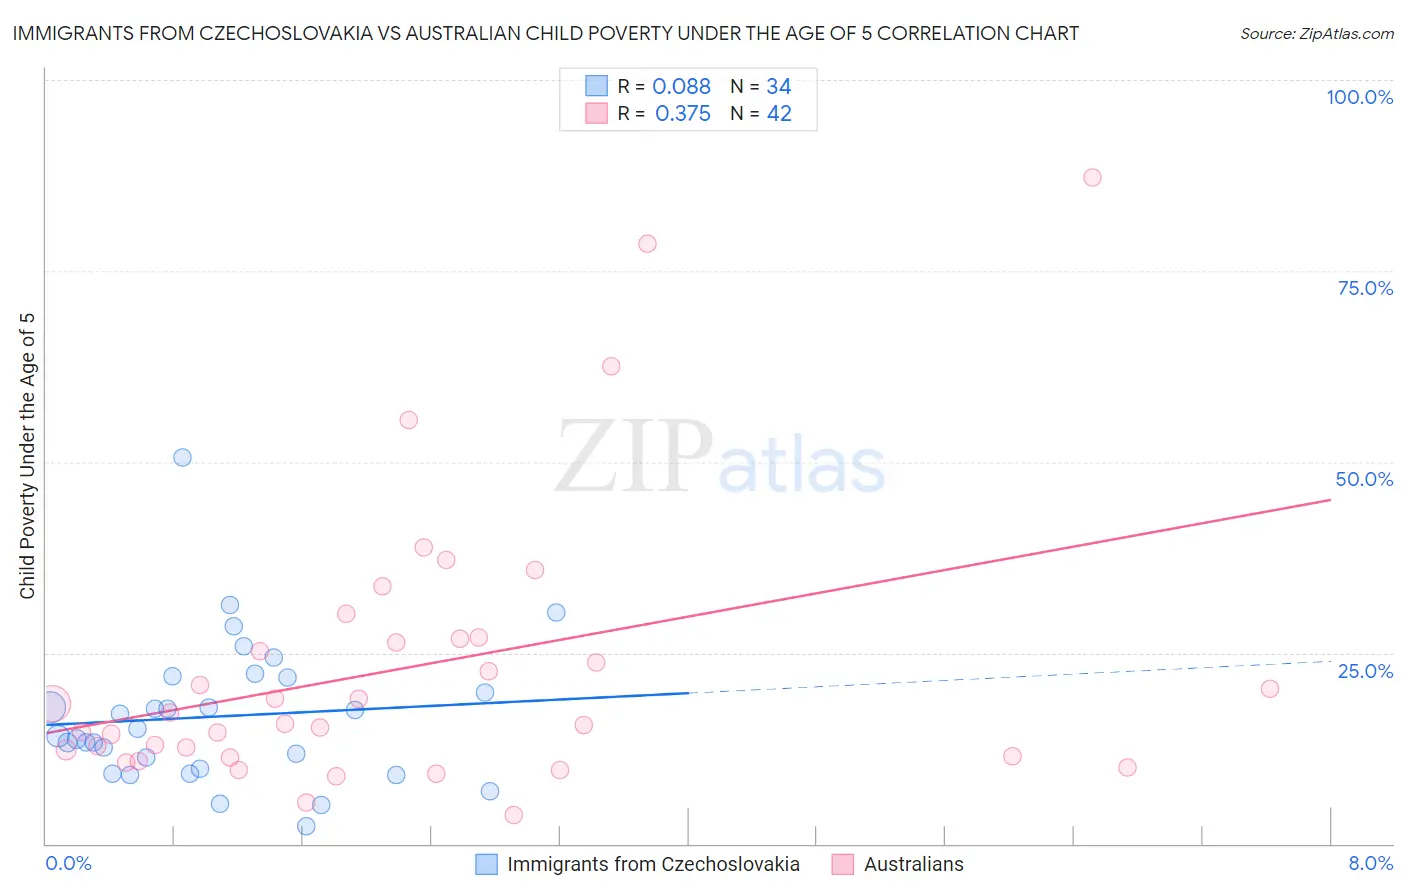
Immigrants from Czechoslovakia vs Australian Child Poverty Under the Age of 5 Correlation Chart
The statistical analysis conducted on geographies consisting of 189,024,563 people shows a slight positive correlation between the proportion of Immigrants from Czechoslovakia and poverty level among children under the age of 5 in the United States with a correlation coefficient (R) of 0.088 and weighted average of 14.8%. Similarly, the statistical analysis conducted on geographies consisting of 216,887,244 people shows a mild positive correlation between the proportion of Australians and poverty level among children under the age of 5 in the United States with a correlation coefficient (R) of 0.375 and weighted average of 15.5%, a difference of 4.9%.
Child Poverty Under the Age of 5 Correlation Summary
| Measurement | Immigrants from Czechoslovakia | Australian |
| Minimum | 2.3% | 3.7% |
| Maximum | 50.5% | 87.2% |
| Range | 48.2% | 83.5% |
| Mean | 16.7% | 23.0% |
| Median | 14.5% | 16.5% |
| Interquartile 25% (IQ1) | 9.8% | 11.4% |
| Interquartile 75% (IQ3) | 21.8% | 26.9% |
| Interquartile Range (IQR) | 12.1% | 15.5% |
| Standard Deviation (Sample) | 9.4% | 18.3% |
| Standard Deviation (Population) | 9.2% | 18.1% |
Similar Demographics by Child Poverty Under the Age of 5
Demographics Similar to Immigrants from Czechoslovakia by Child Poverty Under the Age of 5
In terms of child poverty under the age of 5, the demographic groups most similar to Immigrants from Czechoslovakia are Russian (14.8%, a difference of 0.11%), Immigrants from Bulgaria (14.8%, a difference of 0.15%), Tsimshian (14.7%, a difference of 0.24%), Immigrants from Northern Europe (14.8%, a difference of 0.24%), and Estonian (14.8%, a difference of 0.29%).
| Demographics | Rating | Rank | Child Poverty Under the Age of 5 |
| Immigrants | Belarus | 99.7 /100 | #41 | Exceptional 14.7% |
| Soviet Union | 99.7 /100 | #42 | Exceptional 14.7% |
| Immigrants | Greece | 99.7 /100 | #43 | Exceptional 14.7% |
| Immigrants | Philippines | 99.7 /100 | #44 | Exceptional 14.7% |
| Laotians | 99.6 /100 | #45 | Exceptional 14.7% |
| Tsimshian | 99.6 /100 | #46 | Exceptional 14.7% |
| Russians | 99.6 /100 | #47 | Exceptional 14.8% |
| Immigrants | Czechoslovakia | 99.6 /100 | #48 | Exceptional 14.8% |
| Immigrants | Bulgaria | 99.6 /100 | #49 | Exceptional 14.8% |
| Immigrants | Northern Europe | 99.6 /100 | #50 | Exceptional 14.8% |
| Estonians | 99.6 /100 | #51 | Exceptional 14.8% |
| Immigrants | Serbia | 99.5 /100 | #52 | Exceptional 14.9% |
| Luxembourgers | 99.4 /100 | #53 | Exceptional 14.9% |
| Immigrants | Israel | 99.4 /100 | #54 | Exceptional 14.9% |
| Danes | 99.4 /100 | #55 | Exceptional 14.9% |
Demographics Similar to Australians by Child Poverty Under the Age of 5
In terms of child poverty under the age of 5, the demographic groups most similar to Australians are Italian (15.5%, a difference of 0.11%), Czech (15.5%, a difference of 0.23%), Sri Lankan (15.5%, a difference of 0.25%), Immigrants from Italy (15.6%, a difference of 0.37%), and Chilean (15.6%, a difference of 0.53%).
| Demographics | Rating | Rank | Child Poverty Under the Age of 5 |
| Immigrants | Sweden | 98.8 /100 | #72 | Exceptional 15.3% |
| Immigrants | Ukraine | 98.7 /100 | #73 | Exceptional 15.3% |
| Argentineans | 98.5 /100 | #74 | Exceptional 15.4% |
| Immigrants | Argentina | 98.5 /100 | #75 | Exceptional 15.4% |
| Croatians | 98.5 /100 | #76 | Exceptional 15.4% |
| Immigrants | Turkey | 98.3 /100 | #77 | Exceptional 15.4% |
| Sri Lankans | 98.1 /100 | #78 | Exceptional 15.5% |
| Australians | 98.0 /100 | #79 | Exceptional 15.5% |
| Italians | 97.9 /100 | #80 | Exceptional 15.5% |
| Czechs | 97.8 /100 | #81 | Exceptional 15.5% |
| Immigrants | Italy | 97.7 /100 | #82 | Exceptional 15.6% |
| Chileans | 97.6 /100 | #83 | Exceptional 15.6% |
| Immigrants | Netherlands | 97.6 /100 | #84 | Exceptional 15.6% |
| Immigrants | Latvia | 97.4 /100 | #85 | Exceptional 15.6% |
| Immigrants | Malaysia | 97.4 /100 | #86 | Exceptional 15.6% |