French Canadian vs Comanche 2 or more Vehicles in Household
COMPARE
French Canadian
Comanche
2 or more Vehicles in Household
2 or more Vehicles in Household Comparison
French Canadians
Comanche
58.9%
2 OR MORE VEHICLES IN HOUSEHOLD
99.8/ 100
METRIC RATING
60th/ 347
METRIC RANK
56.5%
2 OR MORE VEHICLES IN HOUSEHOLD
88.4/ 100
METRIC RATING
133rd/ 347
METRIC RANK
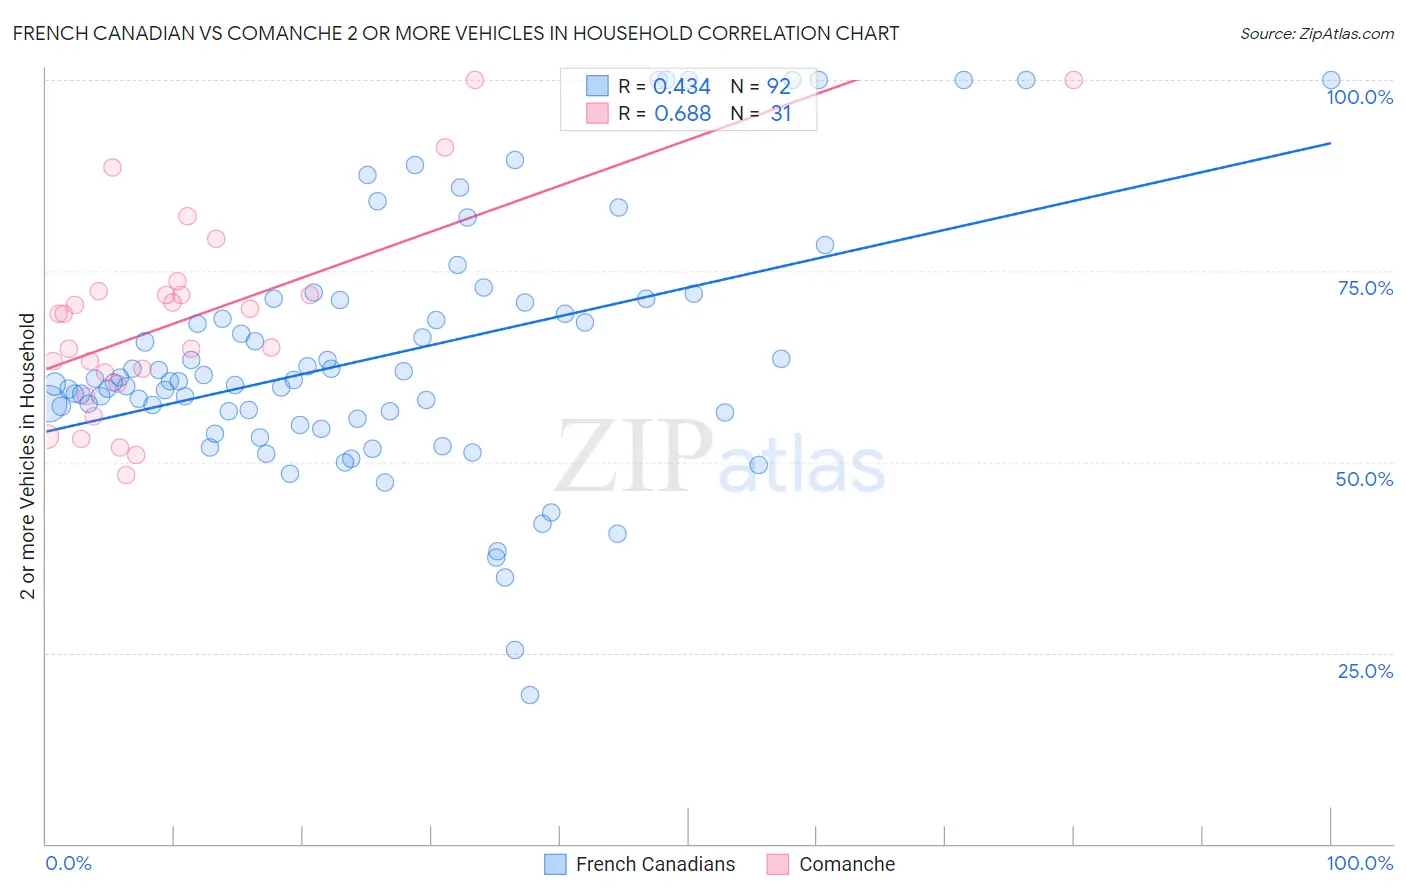
French Canadian vs Comanche 2 or more Vehicles in Household Correlation Chart
The statistical analysis conducted on geographies consisting of 502,331,363 people shows a moderate positive correlation between the proportion of French Canadians and percentage of households with 2 or more vehicles available in the United States with a correlation coefficient (R) of 0.434 and weighted average of 58.9%. Similarly, the statistical analysis conducted on geographies consisting of 109,768,112 people shows a significant positive correlation between the proportion of Comanche and percentage of households with 2 or more vehicles available in the United States with a correlation coefficient (R) of 0.688 and weighted average of 56.5%, a difference of 4.2%.
2 or more Vehicles in Household Correlation Summary
| Measurement | French Canadian | Comanche |
| Minimum | 19.5% | 48.2% |
| Maximum | 100.0% | 100.0% |
| Range | 80.5% | 51.8% |
| Mean | 63.9% | 68.7% |
| Median | 60.5% | 69.4% |
| Interquartile 25% (IQ1) | 56.1% | 60.3% |
| Interquartile 75% (IQ3) | 71.1% | 72.4% |
| Interquartile Range (IQR) | 15.0% | 12.1% |
| Standard Deviation (Sample) | 16.6% | 13.2% |
| Standard Deviation (Population) | 16.5% | 13.0% |
Similar Demographics by 2 or more Vehicles in Household
Demographics Similar to French Canadians by 2 or more Vehicles in Household
In terms of 2 or more vehicles in household, the demographic groups most similar to French Canadians are Spanish American (58.9%, a difference of 0.030%), Immigrants from Scotland (58.9%, a difference of 0.050%), Osage (58.8%, a difference of 0.13%), Nonimmigrants (58.8%, a difference of 0.17%), and Afghan (59.0%, a difference of 0.23%).
| Demographics | Rating | Rank | 2 or more Vehicles in Household |
| Celtics | 99.9 /100 | #53 | Exceptional 59.2% |
| Bhutanese | 99.9 /100 | #54 | Exceptional 59.1% |
| Luxembourgers | 99.9 /100 | #55 | Exceptional 59.1% |
| Chickasaw | 99.9 /100 | #56 | Exceptional 59.0% |
| Afghans | 99.9 /100 | #57 | Exceptional 59.0% |
| Immigrants | Scotland | 99.8 /100 | #58 | Exceptional 58.9% |
| Spanish Americans | 99.8 /100 | #59 | Exceptional 58.9% |
| French Canadians | 99.8 /100 | #60 | Exceptional 58.9% |
| Osage | 99.8 /100 | #61 | Exceptional 58.8% |
| Immigrants | Nonimmigrants | 99.8 /100 | #62 | Exceptional 58.8% |
| Mexican American Indians | 99.8 /100 | #63 | Exceptional 58.7% |
| Portuguese | 99.7 /100 | #64 | Exceptional 58.6% |
| Immigrants | Central America | 99.7 /100 | #65 | Exceptional 58.6% |
| Croatians | 99.7 /100 | #66 | Exceptional 58.6% |
| Laotians | 99.7 /100 | #67 | Exceptional 58.6% |
Demographics Similar to Comanche by 2 or more Vehicles in Household
In terms of 2 or more vehicles in household, the demographic groups most similar to Comanche are Hungarian (56.5%, a difference of 0.070%), Bulgarian (56.5%, a difference of 0.14%), Immigrants from the Azores (56.4%, a difference of 0.16%), Blackfeet (56.4%, a difference of 0.16%), and Yugoslavian (56.6%, a difference of 0.17%).
| Demographics | Rating | Rank | 2 or more Vehicles in Household |
| Estonians | 90.9 /100 | #126 | Exceptional 56.6% |
| Immigrants | Thailand | 90.7 /100 | #127 | Exceptional 56.6% |
| Immigrants | South Central Asia | 90.5 /100 | #128 | Exceptional 56.6% |
| Ute | 90.4 /100 | #129 | Exceptional 56.6% |
| Yugoslavians | 90.0 /100 | #130 | Exceptional 56.6% |
| Bulgarians | 89.7 /100 | #131 | Excellent 56.5% |
| Hungarians | 89.1 /100 | #132 | Excellent 56.5% |
| Comanche | 88.4 /100 | #133 | Excellent 56.5% |
| Immigrants | Azores | 86.6 /100 | #134 | Excellent 56.4% |
| Blackfeet | 86.5 /100 | #135 | Excellent 56.4% |
| Immigrants | Asia | 86.0 /100 | #136 | Excellent 56.3% |
| Cubans | 84.8 /100 | #137 | Excellent 56.3% |
| Salvadorans | 84.7 /100 | #138 | Excellent 56.3% |
| Armenians | 84.3 /100 | #139 | Excellent 56.3% |
| Latvians | 83.6 /100 | #140 | Excellent 56.2% |