Immigrants from China vs Alsatian 1 or more Vehicles in Household
COMPARE
Immigrants from China
Alsatian
1 or more Vehicles in Household
1 or more Vehicles in Household Comparison
Immigrants from China
Alsatians
84.9%
1 OR MORE VEHICLES IN HOUSEHOLD
0.0/ 100
METRIC RATING
305th/ 347
METRIC RANK
87.1%
1 OR MORE VEHICLES IN HOUSEHOLD
0.1/ 100
METRIC RATING
277th/ 347
METRIC RANK
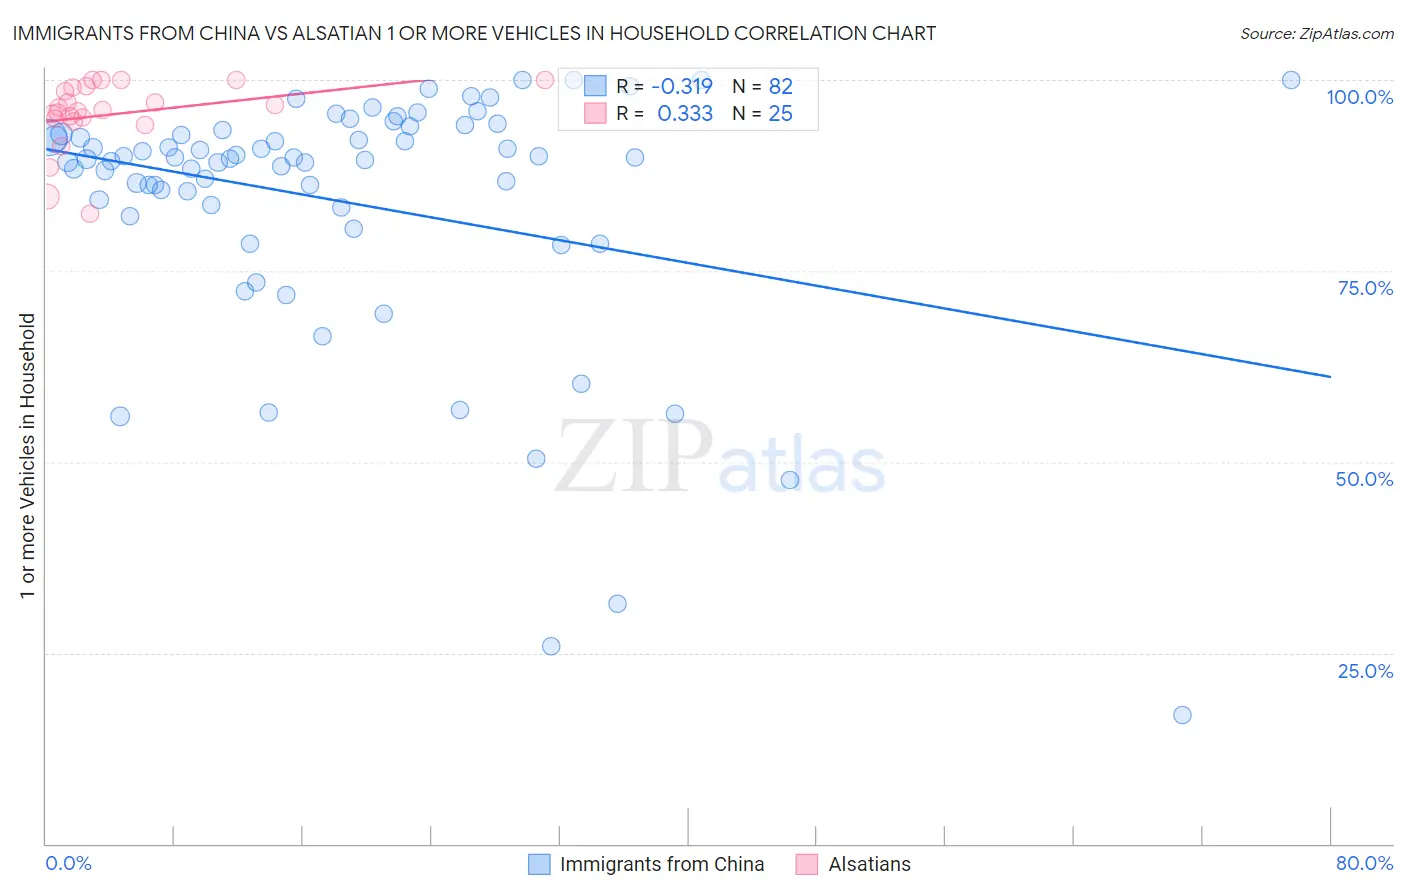
Immigrants from China vs Alsatian 1 or more Vehicles in Household Correlation Chart
The statistical analysis conducted on geographies consisting of 456,603,328 people shows a mild negative correlation between the proportion of Immigrants from China and percentage of households with 1 or more vehicles available in the United States with a correlation coefficient (R) of -0.319 and weighted average of 84.9%. Similarly, the statistical analysis conducted on geographies consisting of 82,680,020 people shows a mild positive correlation between the proportion of Alsatians and percentage of households with 1 or more vehicles available in the United States with a correlation coefficient (R) of 0.333 and weighted average of 87.1%, a difference of 2.5%.
1 or more Vehicles in Household Correlation Summary
| Measurement | Immigrants from China | Alsatian |
| Minimum | 16.8% | 82.5% |
| Maximum | 100.0% | 100.0% |
| Range | 83.2% | 17.5% |
| Mean | 84.0% | 95.5% |
| Median | 89.7% | 96.0% |
| Interquartile 25% (IQ1) | 83.3% | 94.8% |
| Interquartile 75% (IQ3) | 92.9% | 99.0% |
| Interquartile Range (IQR) | 9.6% | 4.3% |
| Standard Deviation (Sample) | 16.7% | 4.6% |
| Standard Deviation (Population) | 16.6% | 4.5% |
Similar Demographics by 1 or more Vehicles in Household
Demographics Similar to Immigrants from China by 1 or more Vehicles in Household
In terms of 1 or more vehicles in household, the demographic groups most similar to Immigrants from China are Immigrants from Western Africa (84.9%, a difference of 0.020%), Tohono O'odham (84.7%, a difference of 0.28%), Immigrants from Belize (84.7%, a difference of 0.31%), Immigrants from Haiti (84.7%, a difference of 0.32%), and Immigrants from Ukraine (85.2%, a difference of 0.34%).
| Demographics | Rating | Rank | 1 or more Vehicles in Household |
| Belizeans | 0.0 /100 | #298 | Tragic 85.7% |
| Yuman | 0.0 /100 | #299 | Tragic 85.5% |
| Immigrants | Russia | 0.0 /100 | #300 | Tragic 85.4% |
| Immigrants | Panama | 0.0 /100 | #301 | Tragic 85.4% |
| Moroccans | 0.0 /100 | #302 | Tragic 85.4% |
| Immigrants | Greece | 0.0 /100 | #303 | Tragic 85.4% |
| Immigrants | Ukraine | 0.0 /100 | #304 | Tragic 85.2% |
| Immigrants | China | 0.0 /100 | #305 | Tragic 84.9% |
| Immigrants | Western Africa | 0.0 /100 | #306 | Tragic 84.9% |
| Tohono O'odham | 0.0 /100 | #307 | Tragic 84.7% |
| Immigrants | Belize | 0.0 /100 | #308 | Tragic 84.7% |
| Immigrants | Haiti | 0.0 /100 | #309 | Tragic 84.7% |
| U.S. Virgin Islanders | 0.0 /100 | #310 | Tragic 84.6% |
| Puerto Ricans | 0.0 /100 | #311 | Tragic 84.6% |
| Cape Verdeans | 0.0 /100 | #312 | Tragic 84.5% |
Demographics Similar to Alsatians by 1 or more Vehicles in Household
In terms of 1 or more vehicles in household, the demographic groups most similar to Alsatians are Immigrants from Southern Europe (87.1%, a difference of 0.040%), Immigrants from Albania (87.1%, a difference of 0.040%), Immigrants from France (87.1%, a difference of 0.060%), Immigrants from Croatia (87.0%, a difference of 0.070%), and Immigrants from Singapore (87.2%, a difference of 0.13%).
| Demographics | Rating | Rank | 1 or more Vehicles in Household |
| Panamanians | 0.2 /100 | #270 | Tragic 87.5% |
| Bermudans | 0.2 /100 | #271 | Tragic 87.5% |
| Aleuts | 0.2 /100 | #272 | Tragic 87.5% |
| Immigrants | Northern Africa | 0.2 /100 | #273 | Tragic 87.4% |
| Immigrants | Morocco | 0.1 /100 | #274 | Tragic 87.4% |
| Immigrants | Singapore | 0.1 /100 | #275 | Tragic 87.2% |
| Immigrants | France | 0.1 /100 | #276 | Tragic 87.1% |
| Alsatians | 0.1 /100 | #277 | Tragic 87.1% |
| Immigrants | Southern Europe | 0.1 /100 | #278 | Tragic 87.1% |
| Immigrants | Albania | 0.1 /100 | #279 | Tragic 87.1% |
| Immigrants | Croatia | 0.0 /100 | #280 | Tragic 87.0% |
| Mongolians | 0.0 /100 | #281 | Tragic 87.0% |
| Colville | 0.0 /100 | #282 | Tragic 86.8% |
| Immigrants | Eastern Europe | 0.0 /100 | #283 | Tragic 86.7% |
| Central American Indians | 0.0 /100 | #284 | Tragic 86.7% |