Immigrants from Cameroon vs Estonian 1 or more Vehicles in Household
COMPARE
Immigrants from Cameroon
Estonian
1 or more Vehicles in Household
1 or more Vehicles in Household Comparison
Immigrants from Cameroon
Estonians
90.4%
1 OR MORE VEHICLES IN HOUSEHOLD
89.4/ 100
METRIC RATING
126th/ 347
METRIC RANK
90.3%
1 OR MORE VEHICLES IN HOUSEHOLD
85.6/ 100
METRIC RATING
139th/ 347
METRIC RANK
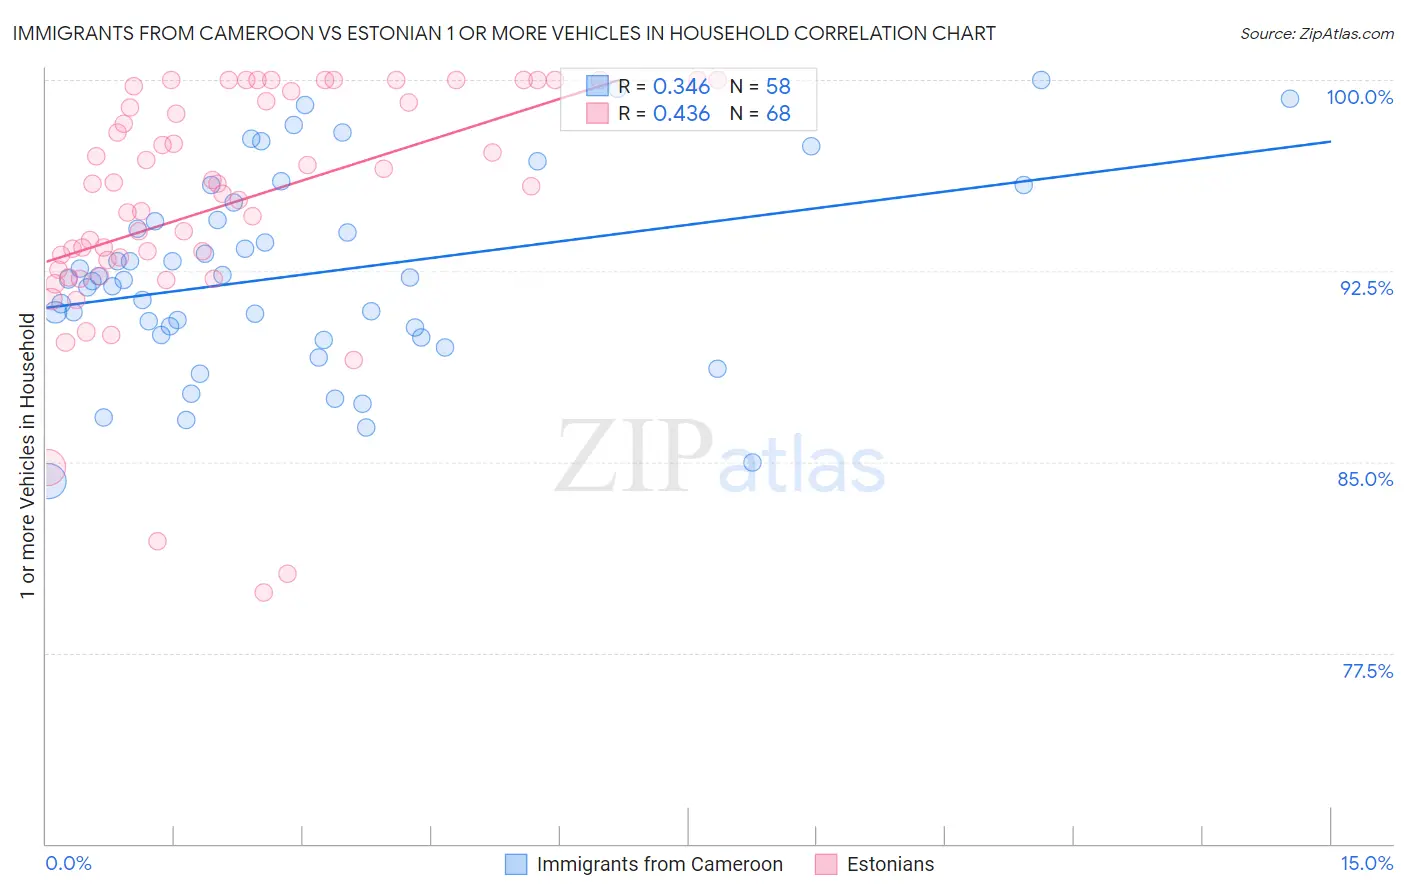
Immigrants from Cameroon vs Estonian 1 or more Vehicles in Household Correlation Chart
The statistical analysis conducted on geographies consisting of 130,744,557 people shows a mild positive correlation between the proportion of Immigrants from Cameroon and percentage of households with 1 or more vehicles available in the United States with a correlation coefficient (R) of 0.346 and weighted average of 90.4%. Similarly, the statistical analysis conducted on geographies consisting of 123,503,955 people shows a moderate positive correlation between the proportion of Estonians and percentage of households with 1 or more vehicles available in the United States with a correlation coefficient (R) of 0.436 and weighted average of 90.3%, a difference of 0.13%.
1 or more Vehicles in Household Correlation Summary
| Measurement | Immigrants from Cameroon | Estonian |
| Minimum | 84.2% | 79.9% |
| Maximum | 100.0% | 100.0% |
| Range | 15.8% | 20.1% |
| Mean | 92.4% | 95.1% |
| Median | 92.2% | 95.9% |
| Interquartile 25% (IQ1) | 90.0% | 92.7% |
| Interquartile 75% (IQ3) | 94.5% | 99.4% |
| Interquartile Range (IQR) | 4.5% | 6.6% |
| Standard Deviation (Sample) | 3.8% | 4.7% |
| Standard Deviation (Population) | 3.8% | 4.6% |
Demographics Similar to Immigrants from Cameroon and Estonians by 1 or more Vehicles in Household
In terms of 1 or more vehicles in household, the demographic groups most similar to Immigrants from Cameroon are Immigrants from the Azores (90.4%, a difference of 0.010%), Burmese (90.4%, a difference of 0.010%), Marshallese (90.4%, a difference of 0.020%), Nicaraguan (90.4%, a difference of 0.020%), and Immigrants from Kenya (90.4%, a difference of 0.040%). Similarly, the demographic groups most similar to Estonians are Sudanese (90.3%, a difference of 0.010%), Latvian (90.3%, a difference of 0.020%), Syrian (90.3%, a difference of 0.020%), Hungarian (90.3%, a difference of 0.030%), and Kenyan (90.4%, a difference of 0.040%).
| Demographics | Rating | Rank | 1 or more Vehicles in Household |
| Costa Ricans | 92.0 /100 | #122 | Exceptional 90.5% |
| Fijians | 91.8 /100 | #123 | Exceptional 90.5% |
| Puget Sound Salish | 91.5 /100 | #124 | Exceptional 90.5% |
| Immigrants | Korea | 90.5 /100 | #125 | Exceptional 90.5% |
| Immigrants | Cameroon | 89.4 /100 | #126 | Excellent 90.4% |
| Immigrants | Azores | 89.1 /100 | #127 | Excellent 90.4% |
| Burmese | 89.0 /100 | #128 | Excellent 90.4% |
| Marshallese | 88.9 /100 | #129 | Excellent 90.4% |
| Nicaraguans | 88.8 /100 | #130 | Excellent 90.4% |
| Immigrants | Kenya | 88.5 /100 | #131 | Excellent 90.4% |
| Immigrants | South Africa | 88.1 /100 | #132 | Excellent 90.4% |
| Immigrants | Syria | 87.5 /100 | #133 | Excellent 90.4% |
| Kenyans | 87.0 /100 | #134 | Excellent 90.4% |
| Immigrants | Oceania | 86.9 /100 | #135 | Excellent 90.4% |
| Hungarians | 86.5 /100 | #136 | Excellent 90.3% |
| Latvians | 86.3 /100 | #137 | Excellent 90.3% |
| Syrians | 86.3 /100 | #138 | Excellent 90.3% |
| Estonians | 85.6 /100 | #139 | Excellent 90.3% |
| Sudanese | 85.2 /100 | #140 | Excellent 90.3% |
| Immigrants | Moldova | 83.1 /100 | #141 | Excellent 90.2% |
| Immigrants | Lithuania | 83.0 /100 | #142 | Excellent 90.2% |