Immigrants from Burma/Myanmar vs Apache 1 or more Vehicles in Household
COMPARE
Immigrants from Burma/Myanmar
Apache
1 or more Vehicles in Household
1 or more Vehicles in Household Comparison
Immigrants from Burma/Myanmar
Apache
89.7%
1 OR MORE VEHICLES IN HOUSEHOLD
47.6/ 100
METRIC RATING
175th/ 347
METRIC RANK
89.1%
1 OR MORE VEHICLES IN HOUSEHOLD
16.2/ 100
METRIC RATING
206th/ 347
METRIC RANK
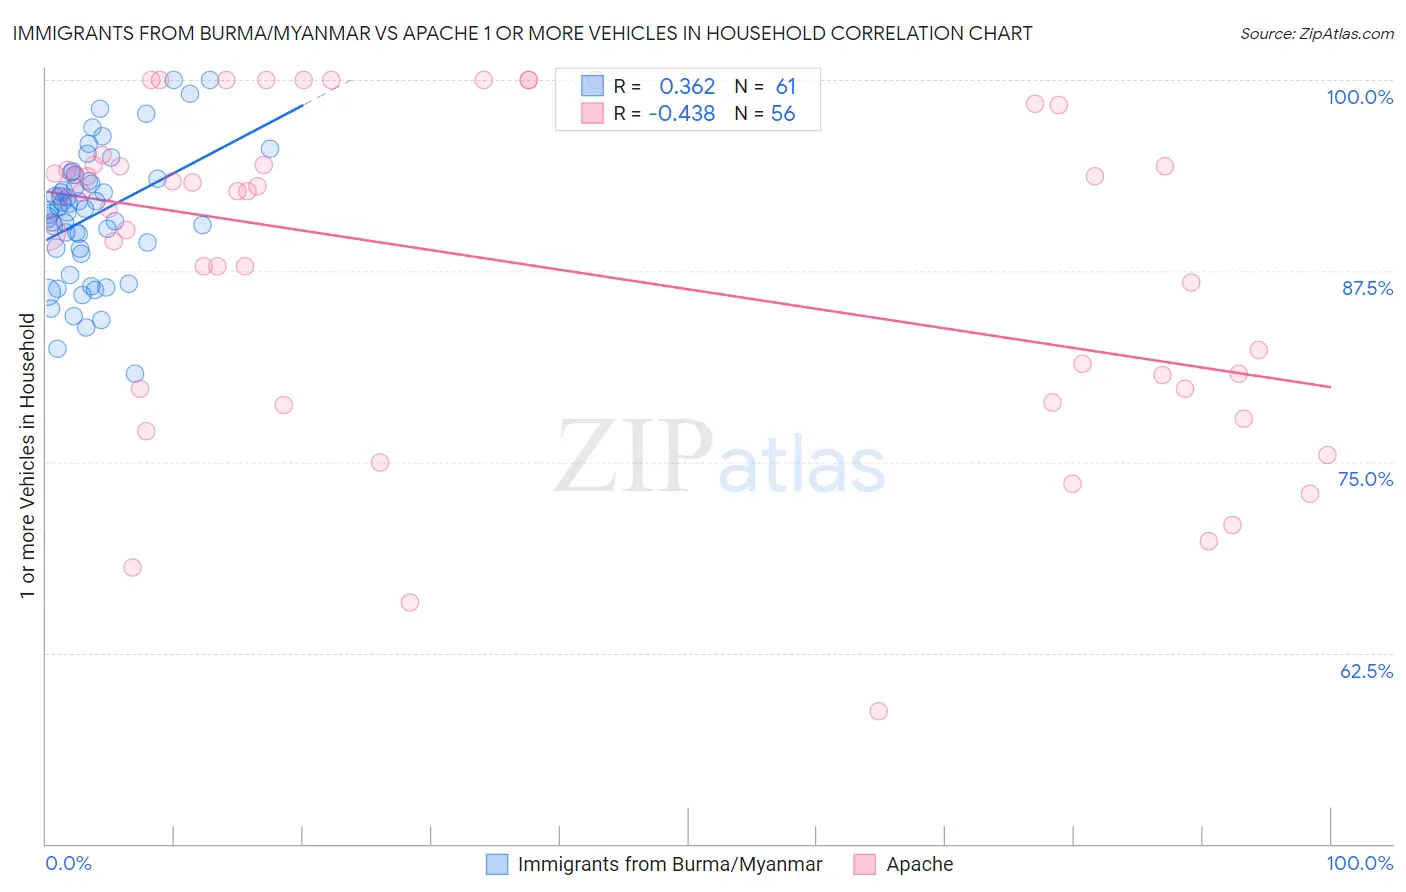
Immigrants from Burma/Myanmar vs Apache 1 or more Vehicles in Household Correlation Chart
The statistical analysis conducted on geographies consisting of 172,231,522 people shows a mild positive correlation between the proportion of Immigrants from Burma/Myanmar and percentage of households with 1 or more vehicles available in the United States with a correlation coefficient (R) of 0.362 and weighted average of 89.7%. Similarly, the statistical analysis conducted on geographies consisting of 231,048,129 people shows a moderate negative correlation between the proportion of Apache and percentage of households with 1 or more vehicles available in the United States with a correlation coefficient (R) of -0.438 and weighted average of 89.1%, a difference of 0.61%.
1 or more Vehicles in Household Correlation Summary
| Measurement | Immigrants from Burma/Myanmar | Apache |
| Minimum | 80.7% | 58.7% |
| Maximum | 100.0% | 100.0% |
| Range | 19.3% | 41.3% |
| Mean | 91.1% | 88.0% |
| Median | 91.5% | 92.5% |
| Interquartile 25% (IQ1) | 88.8% | 79.8% |
| Interquartile 75% (IQ3) | 93.5% | 94.4% |
| Interquartile Range (IQR) | 4.7% | 14.6% |
| Standard Deviation (Sample) | 4.2% | 10.5% |
| Standard Deviation (Population) | 4.2% | 10.4% |
Similar Demographics by 1 or more Vehicles in Household
Demographics Similar to Immigrants from Burma/Myanmar by 1 or more Vehicles in Household
In terms of 1 or more vehicles in household, the demographic groups most similar to Immigrants from Burma/Myanmar are Immigrants from Sudan (89.7%, a difference of 0.010%), Hmong (89.6%, a difference of 0.030%), Filipino (89.7%, a difference of 0.040%), Immigrants from El Salvador (89.6%, a difference of 0.050%), and German Russian (89.6%, a difference of 0.060%).
| Demographics | Rating | Rank | 1 or more Vehicles in Household |
| Immigrants | Cambodia | 60.1 /100 | #168 | Good 89.8% |
| Natives/Alaskans | 59.5 /100 | #169 | Average 89.8% |
| Immigrants | Costa Rica | 57.6 /100 | #170 | Average 89.8% |
| French American Indians | 54.4 /100 | #171 | Average 89.8% |
| Indonesians | 53.0 /100 | #172 | Average 89.7% |
| Lumbee | 52.8 /100 | #173 | Average 89.7% |
| Filipinos | 50.0 /100 | #174 | Average 89.7% |
| Immigrants | Burma/Myanmar | 47.6 /100 | #175 | Average 89.7% |
| Immigrants | Sudan | 47.1 /100 | #176 | Average 89.7% |
| Hmong | 45.8 /100 | #177 | Average 89.6% |
| Immigrants | El Salvador | 44.1 /100 | #178 | Average 89.6% |
| German Russians | 44.0 /100 | #179 | Average 89.6% |
| Arabs | 43.3 /100 | #180 | Average 89.6% |
| Immigrants | Ethiopia | 42.5 /100 | #181 | Average 89.6% |
| Ukrainians | 42.4 /100 | #182 | Average 89.6% |
Demographics Similar to Apache by 1 or more Vehicles in Household
In terms of 1 or more vehicles in household, the demographic groups most similar to Apache are Immigrants from Denmark (89.1%, a difference of 0.040%), Guatemalan (89.2%, a difference of 0.050%), Immigrants from Chile (89.1%, a difference of 0.050%), Romanian (89.2%, a difference of 0.060%), and Immigrants from Italy (89.1%, a difference of 0.070%).
| Demographics | Rating | Rank | 1 or more Vehicles in Household |
| Immigrants | Asia | 22.8 /100 | #199 | Fair 89.3% |
| Central Americans | 21.4 /100 | #200 | Fair 89.2% |
| Immigrants | Western Europe | 20.5 /100 | #201 | Fair 89.2% |
| Iroquois | 19.8 /100 | #202 | Poor 89.2% |
| Cambodians | 18.9 /100 | #203 | Poor 89.2% |
| Romanians | 18.2 /100 | #204 | Poor 89.2% |
| Guatemalans | 17.8 /100 | #205 | Poor 89.2% |
| Apache | 16.2 /100 | #206 | Poor 89.1% |
| Immigrants | Denmark | 14.8 /100 | #207 | Poor 89.1% |
| Immigrants | Chile | 14.4 /100 | #208 | Poor 89.1% |
| Immigrants | Italy | 14.0 /100 | #209 | Poor 89.1% |
| Dutch West Indians | 13.5 /100 | #210 | Poor 89.0% |
| Sierra Leoneans | 13.0 /100 | #211 | Poor 89.0% |
| Somalis | 12.8 /100 | #212 | Poor 89.0% |
| Immigrants | Western Asia | 12.3 /100 | #213 | Poor 89.0% |