Immigrants from Brazil vs Israeli 1 or more Vehicles in Household
COMPARE
Immigrants from Brazil
Israeli
1 or more Vehicles in Household
1 or more Vehicles in Household Comparison
Immigrants from Brazil
Israelis
89.6%
1 OR MORE VEHICLES IN HOUSEHOLD
40.1/ 100
METRIC RATING
185th/ 347
METRIC RANK
87.7%
1 OR MORE VEHICLES IN HOUSEHOLD
0.3/ 100
METRIC RATING
266th/ 347
METRIC RANK
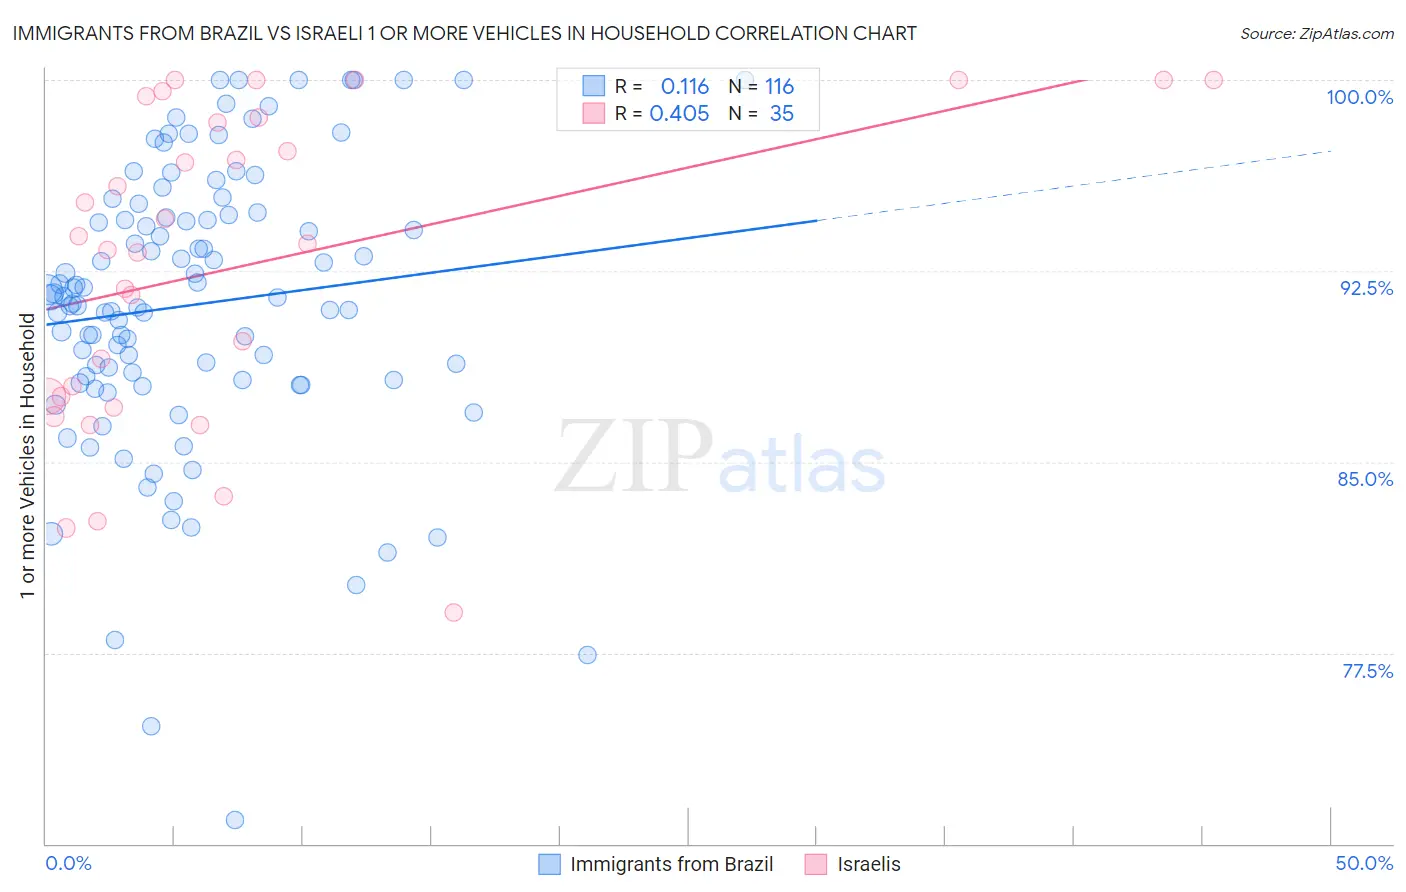
Immigrants from Brazil vs Israeli 1 or more Vehicles in Household Correlation Chart
The statistical analysis conducted on geographies consisting of 342,498,313 people shows a poor positive correlation between the proportion of Immigrants from Brazil and percentage of households with 1 or more vehicles available in the United States with a correlation coefficient (R) of 0.116 and weighted average of 89.6%. Similarly, the statistical analysis conducted on geographies consisting of 211,015,607 people shows a moderate positive correlation between the proportion of Israelis and percentage of households with 1 or more vehicles available in the United States with a correlation coefficient (R) of 0.405 and weighted average of 87.7%, a difference of 2.2%.
1 or more Vehicles in Household Correlation Summary
| Measurement | Immigrants from Brazil | Israeli |
| Minimum | 70.9% | 79.1% |
| Maximum | 100.0% | 100.0% |
| Range | 29.1% | 20.9% |
| Mean | 91.2% | 92.7% |
| Median | 91.5% | 93.5% |
| Interquartile 25% (IQ1) | 88.2% | 87.6% |
| Interquartile 75% (IQ3) | 94.7% | 98.5% |
| Interquartile Range (IQR) | 6.4% | 11.0% |
| Standard Deviation (Sample) | 5.6% | 6.1% |
| Standard Deviation (Population) | 5.6% | 6.0% |
Similar Demographics by 1 or more Vehicles in Household
Demographics Similar to Immigrants from Brazil by 1 or more Vehicles in Household
In terms of 1 or more vehicles in household, the demographic groups most similar to Immigrants from Brazil are Pueblo (89.6%, a difference of 0.0%), Immigrants from Bulgaria (89.6%, a difference of 0.010%), South American (89.5%, a difference of 0.010%), Ethiopian (89.6%, a difference of 0.020%), and Immigrants from Nepal (89.5%, a difference of 0.020%).
| Demographics | Rating | Rank | 1 or more Vehicles in Household |
| Immigrants | El Salvador | 44.1 /100 | #178 | Average 89.6% |
| German Russians | 44.0 /100 | #179 | Average 89.6% |
| Arabs | 43.3 /100 | #180 | Average 89.6% |
| Immigrants | Ethiopia | 42.5 /100 | #181 | Average 89.6% |
| Ukrainians | 42.4 /100 | #182 | Average 89.6% |
| Ethiopians | 41.2 /100 | #183 | Average 89.6% |
| Immigrants | Bulgaria | 40.7 /100 | #184 | Average 89.6% |
| Immigrants | Brazil | 40.1 /100 | #185 | Average 89.6% |
| Pueblo | 39.9 /100 | #186 | Fair 89.6% |
| South Americans | 39.6 /100 | #187 | Fair 89.5% |
| Immigrants | Nepal | 38.9 /100 | #188 | Fair 89.5% |
| Carpatho Rusyns | 37.8 /100 | #189 | Fair 89.5% |
| Shoshone | 37.5 /100 | #190 | Fair 89.5% |
| Immigrants | Poland | 37.1 /100 | #191 | Fair 89.5% |
| Immigrants | North Macedonia | 36.5 /100 | #192 | Fair 89.5% |
Demographics Similar to Israelis by 1 or more Vehicles in Household
In terms of 1 or more vehicles in household, the demographic groups most similar to Israelis are Immigrants from Colombia (87.6%, a difference of 0.030%), Immigrants from Europe (87.6%, a difference of 0.070%), Immigrants from Africa (87.6%, a difference of 0.12%), Panamanian (87.5%, a difference of 0.13%), and Bermudan (87.5%, a difference of 0.13%).
| Demographics | Rating | Rank | 1 or more Vehicles in Household |
| Nigerians | 0.8 /100 | #259 | Tragic 88.0% |
| Macedonians | 0.6 /100 | #260 | Tragic 87.9% |
| Immigrants | Switzerland | 0.6 /100 | #261 | Tragic 87.9% |
| Sub-Saharan Africans | 0.5 /100 | #262 | Tragic 87.9% |
| Immigrants | Egypt | 0.5 /100 | #263 | Tragic 87.8% |
| Immigrants | Liberia | 0.4 /100 | #264 | Tragic 87.8% |
| Africans | 0.4 /100 | #265 | Tragic 87.8% |
| Israelis | 0.3 /100 | #266 | Tragic 87.7% |
| Immigrants | Colombia | 0.3 /100 | #267 | Tragic 87.6% |
| Immigrants | Europe | 0.2 /100 | #268 | Tragic 87.6% |
| Immigrants | Africa | 0.2 /100 | #269 | Tragic 87.6% |
| Panamanians | 0.2 /100 | #270 | Tragic 87.5% |
| Bermudans | 0.2 /100 | #271 | Tragic 87.5% |
| Aleuts | 0.2 /100 | #272 | Tragic 87.5% |
| Immigrants | Northern Africa | 0.2 /100 | #273 | Tragic 87.4% |