Immigrants from Bahamas vs Serbian 1 or more Vehicles in Household
COMPARE
Immigrants from Bahamas
Serbian
1 or more Vehicles in Household
1 or more Vehicles in Household Comparison
Immigrants from Bahamas
Serbians
90.2%
1 OR MORE VEHICLES IN HOUSEHOLD
81.5/ 100
METRIC RATING
143rd/ 347
METRIC RANK
90.7%
1 OR MORE VEHICLES IN HOUSEHOLD
94.3/ 100
METRIC RATING
115th/ 347
METRIC RANK
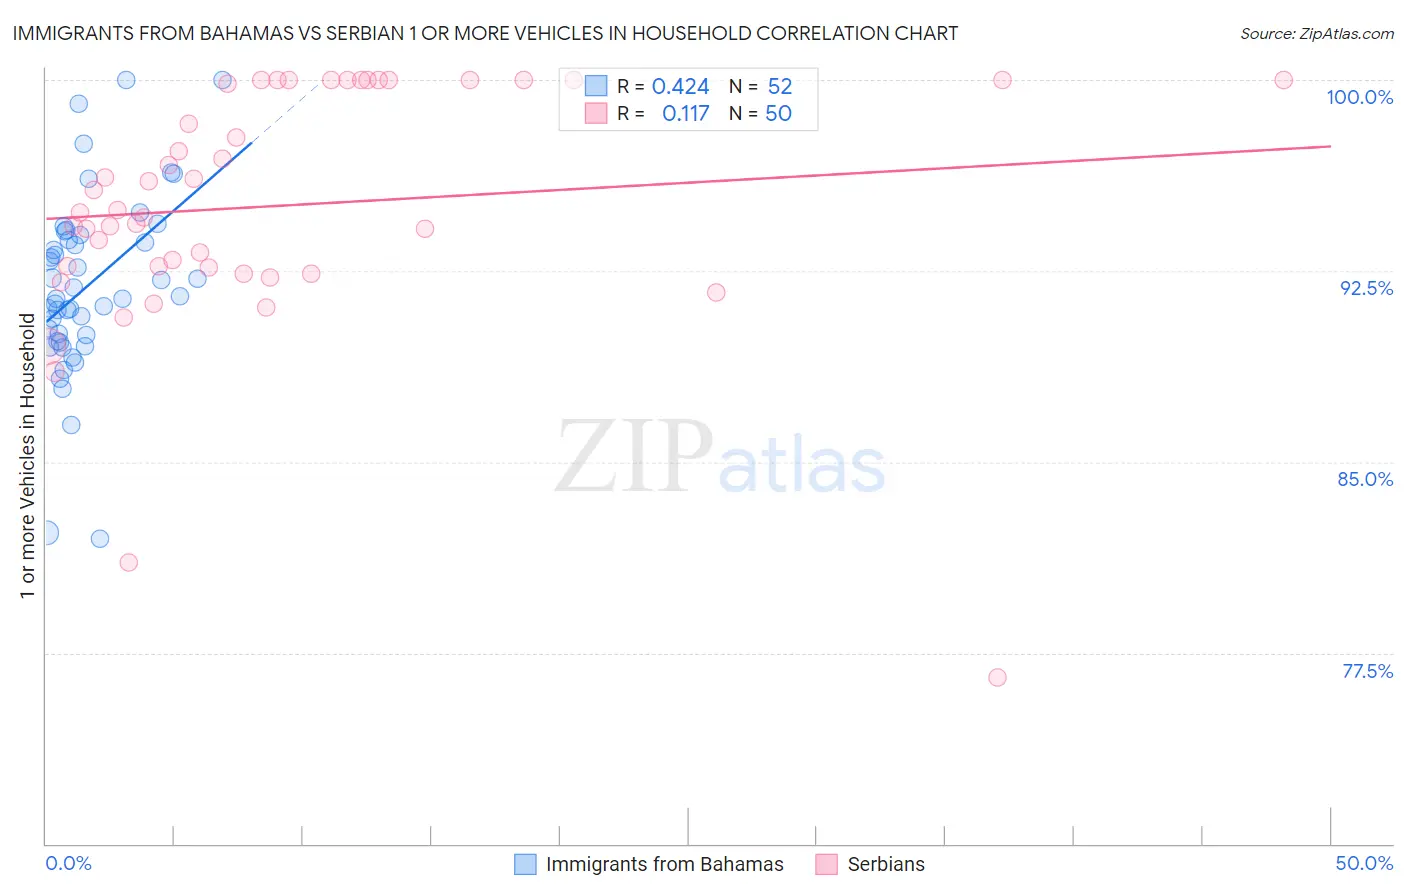
Immigrants from Bahamas vs Serbian 1 or more Vehicles in Household Correlation Chart
The statistical analysis conducted on geographies consisting of 104,615,512 people shows a moderate positive correlation between the proportion of Immigrants from Bahamas and percentage of households with 1 or more vehicles available in the United States with a correlation coefficient (R) of 0.424 and weighted average of 90.2%. Similarly, the statistical analysis conducted on geographies consisting of 267,548,486 people shows a poor positive correlation between the proportion of Serbians and percentage of households with 1 or more vehicles available in the United States with a correlation coefficient (R) of 0.117 and weighted average of 90.7%, a difference of 0.51%.
1 or more Vehicles in Household Correlation Summary
| Measurement | Immigrants from Bahamas | Serbian |
| Minimum | 82.0% | 76.5% |
| Maximum | 100.0% | 100.0% |
| Range | 18.0% | 23.5% |
| Mean | 91.9% | 95.1% |
| Median | 91.5% | 94.8% |
| Interquartile 25% (IQ1) | 89.9% | 92.6% |
| Interquartile 75% (IQ3) | 93.8% | 100.0% |
| Interquartile Range (IQR) | 3.9% | 7.4% |
| Standard Deviation (Sample) | 3.6% | 4.8% |
| Standard Deviation (Population) | 3.5% | 4.8% |
Similar Demographics by 1 or more Vehicles in Household
Demographics Similar to Immigrants from Bahamas by 1 or more Vehicles in Household
In terms of 1 or more vehicles in household, the demographic groups most similar to Immigrants from Bahamas are Immigrants from Zimbabwe (90.2%, a difference of 0.0%), Sioux (90.2%, a difference of 0.010%), Bahamian (90.2%, a difference of 0.030%), Immigrants from Moldova (90.2%, a difference of 0.040%), and Immigrants from Lithuania (90.2%, a difference of 0.040%).
| Demographics | Rating | Rank | 1 or more Vehicles in Household |
| Hungarians | 86.5 /100 | #136 | Excellent 90.3% |
| Latvians | 86.3 /100 | #137 | Excellent 90.3% |
| Syrians | 86.3 /100 | #138 | Excellent 90.3% |
| Estonians | 85.6 /100 | #139 | Excellent 90.3% |
| Sudanese | 85.2 /100 | #140 | Excellent 90.3% |
| Immigrants | Moldova | 83.1 /100 | #141 | Excellent 90.2% |
| Immigrants | Lithuania | 83.0 /100 | #142 | Excellent 90.2% |
| Immigrants | Bahamas | 81.5 /100 | #143 | Excellent 90.2% |
| Immigrants | Zimbabwe | 81.5 /100 | #144 | Excellent 90.2% |
| Sioux | 81.3 /100 | #145 | Excellent 90.2% |
| Bahamians | 80.5 /100 | #146 | Excellent 90.2% |
| Chileans | 79.8 /100 | #147 | Good 90.2% |
| Immigrants | Eastern Africa | 78.2 /100 | #148 | Good 90.1% |
| Immigrants | Nicaragua | 76.7 /100 | #149 | Good 90.1% |
| Immigrants | Micronesia | 75.9 /100 | #150 | Good 90.1% |
Demographics Similar to Serbians by 1 or more Vehicles in Household
In terms of 1 or more vehicles in household, the demographic groups most similar to Serbians are Chippewa (90.7%, a difference of 0.0%), Armenian (90.7%, a difference of 0.020%), Immigrants from Kuwait (90.7%, a difference of 0.030%), Greek (90.6%, a difference of 0.050%), and Japanese (90.6%, a difference of 0.060%).
| Demographics | Rating | Rank | 1 or more Vehicles in Household |
| Hispanics or Latinos | 97.6 /100 | #108 | Exceptional 91.0% |
| Delaware | 97.6 /100 | #109 | Exceptional 91.0% |
| Mexican American Indians | 97.4 /100 | #110 | Exceptional 91.0% |
| Navajo | 95.8 /100 | #111 | Exceptional 90.8% |
| Immigrants | Netherlands | 95.7 /100 | #112 | Exceptional 90.8% |
| Immigrants | Kuwait | 94.7 /100 | #113 | Exceptional 90.7% |
| Armenians | 94.5 /100 | #114 | Exceptional 90.7% |
| Serbians | 94.3 /100 | #115 | Exceptional 90.7% |
| Chippewa | 94.3 /100 | #116 | Exceptional 90.7% |
| Greeks | 93.5 /100 | #117 | Exceptional 90.6% |
| Japanese | 93.4 /100 | #118 | Exceptional 90.6% |
| Blackfeet | 92.6 /100 | #119 | Exceptional 90.6% |
| Immigrants | Thailand | 92.3 /100 | #120 | Exceptional 90.6% |
| Icelanders | 92.1 /100 | #121 | Exceptional 90.5% |
| Costa Ricans | 92.0 /100 | #122 | Exceptional 90.5% |