Immigrants from Bahamas vs French Female Unemployment
COMPARE
Immigrants from Bahamas
French
Female Unemployment
Female Unemployment Comparison
Immigrants from Bahamas
French
5.8%
FEMALE UNEMPLOYMENT
0.1/ 100
METRIC RATING
264th/ 347
METRIC RANK
4.8%
FEMALE UNEMPLOYMENT
99.6/ 100
METRIC RATING
40th/ 347
METRIC RANK
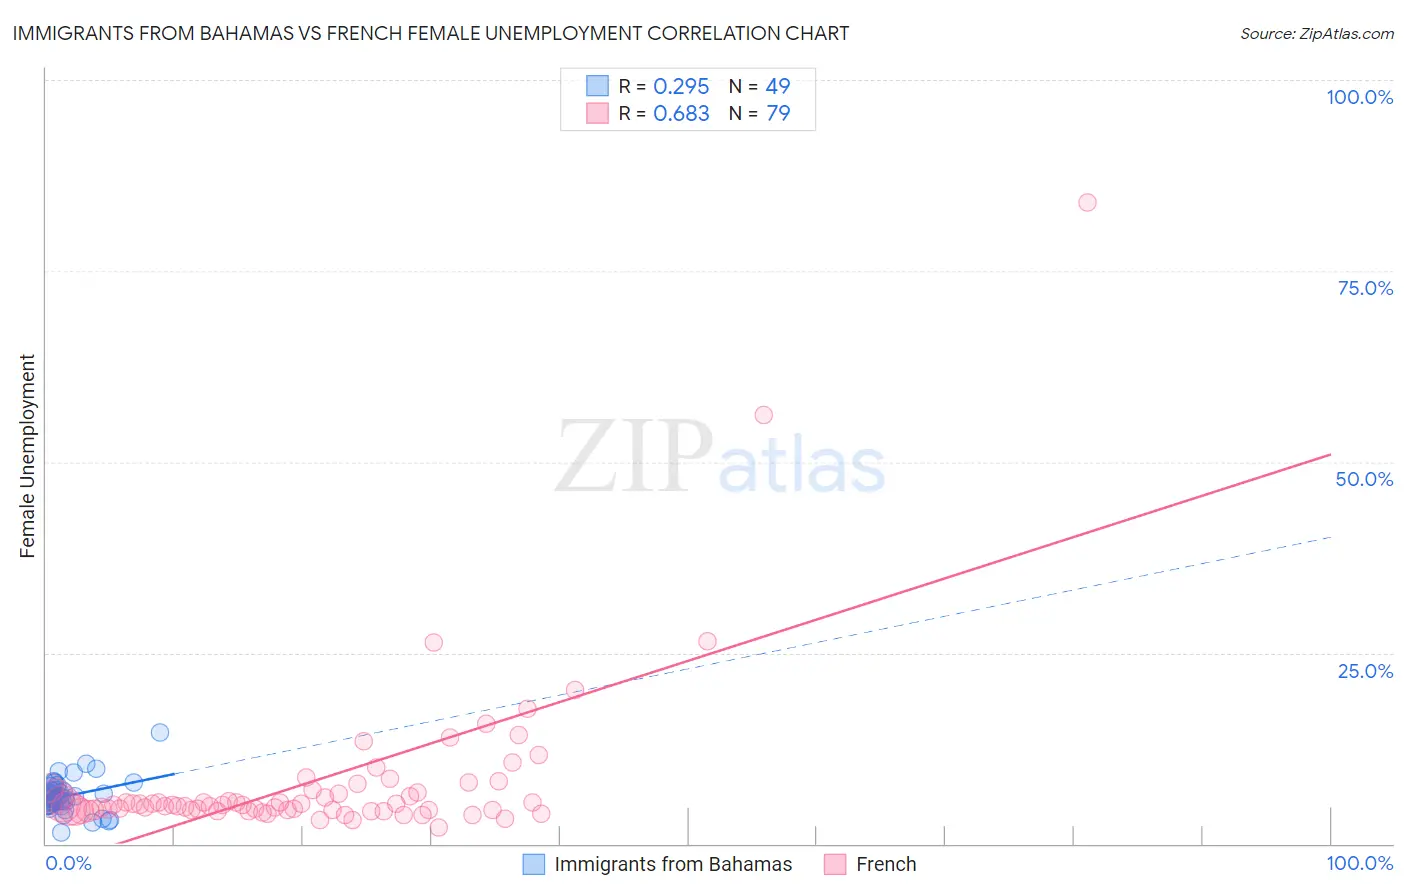
Immigrants from Bahamas vs French Female Unemployment Correlation Chart
The statistical analysis conducted on geographies consisting of 104,550,633 people shows a weak positive correlation between the proportion of Immigrants from Bahamas and unemploymnet rate among females in the United States with a correlation coefficient (R) of 0.295 and weighted average of 5.8%. Similarly, the statistical analysis conducted on geographies consisting of 558,400,346 people shows a significant positive correlation between the proportion of French and unemploymnet rate among females in the United States with a correlation coefficient (R) of 0.683 and weighted average of 4.8%, a difference of 21.0%.
Female Unemployment Correlation Summary
| Measurement | Immigrants from Bahamas | French |
| Minimum | 1.4% | 2.0% |
| Maximum | 14.6% | 84.0% |
| Range | 13.2% | 82.0% |
| Mean | 6.2% | 8.3% |
| Median | 5.9% | 5.1% |
| Interquartile 25% (IQ1) | 5.1% | 4.4% |
| Interquartile 75% (IQ3) | 7.0% | 7.1% |
| Interquartile Range (IQR) | 1.9% | 2.7% |
| Standard Deviation (Sample) | 2.2% | 11.3% |
| Standard Deviation (Population) | 2.2% | 11.2% |
Similar Demographics by Female Unemployment
Demographics Similar to Immigrants from Bahamas by Female Unemployment
In terms of female unemployment, the demographic groups most similar to Immigrants from Bahamas are Immigrants from the Azores (5.8%, a difference of 0.39%), Blackfeet (5.9%, a difference of 0.40%), Cape Verdean (5.9%, a difference of 0.68%), Nepalese (5.9%, a difference of 0.79%), and Honduran (5.9%, a difference of 0.89%).
| Demographics | Rating | Rank | Female Unemployment |
| Dutch West Indians | 0.3 /100 | #257 | Tragic 5.7% |
| Immigrants | Portugal | 0.2 /100 | #258 | Tragic 5.8% |
| Immigrants | Fiji | 0.2 /100 | #259 | Tragic 5.8% |
| Nigerians | 0.2 /100 | #260 | Tragic 5.8% |
| Kiowa | 0.1 /100 | #261 | Tragic 5.8% |
| Immigrants | Nigeria | 0.1 /100 | #262 | Tragic 5.8% |
| Immigrants | Azores | 0.1 /100 | #263 | Tragic 5.8% |
| Immigrants | Bahamas | 0.1 /100 | #264 | Tragic 5.8% |
| Blackfeet | 0.0 /100 | #265 | Tragic 5.9% |
| Cape Verdeans | 0.0 /100 | #266 | Tragic 5.9% |
| Nepalese | 0.0 /100 | #267 | Tragic 5.9% |
| Hondurans | 0.0 /100 | #268 | Tragic 5.9% |
| Immigrants | Western Africa | 0.0 /100 | #269 | Tragic 5.9% |
| Immigrants | Honduras | 0.0 /100 | #270 | Tragic 5.9% |
| Central Americans | 0.0 /100 | #271 | Tragic 5.9% |
Demographics Similar to French by Female Unemployment
In terms of female unemployment, the demographic groups most similar to French are Scotch-Irish (4.8%, a difference of 0.040%), Northern European (4.8%, a difference of 0.050%), Pennsylvania German (4.8%, a difference of 0.16%), Tongan (4.8%, a difference of 0.26%), and Italian (4.8%, a difference of 0.39%).
| Demographics | Rating | Rank | Female Unemployment |
| Czechoslovakians | 99.7 /100 | #33 | Exceptional 4.8% |
| Zimbabweans | 99.7 /100 | #34 | Exceptional 4.8% |
| French Canadians | 99.7 /100 | #35 | Exceptional 4.8% |
| Yugoslavians | 99.7 /100 | #36 | Exceptional 4.8% |
| Pennsylvania Germans | 99.6 /100 | #37 | Exceptional 4.8% |
| Northern Europeans | 99.6 /100 | #38 | Exceptional 4.8% |
| Scotch-Irish | 99.6 /100 | #39 | Exceptional 4.8% |
| French | 99.6 /100 | #40 | Exceptional 4.8% |
| Tongans | 99.5 /100 | #41 | Exceptional 4.8% |
| Italians | 99.5 /100 | #42 | Exceptional 4.8% |
| Eastern Europeans | 99.4 /100 | #43 | Exceptional 4.9% |
| Greeks | 99.4 /100 | #44 | Exceptional 4.9% |
| Austrians | 99.3 /100 | #45 | Exceptional 4.9% |
| Immigrants | Bulgaria | 99.3 /100 | #46 | Exceptional 4.9% |
| Okinawans | 99.3 /100 | #47 | Exceptional 4.9% |