Immigrants from Bahamas vs French Unemployment Among Women with Children Ages 6 to 17 years
COMPARE
Immigrants from Bahamas
French
Unemployment Among Women with Children Ages 6 to 17 years
Unemployment Among Women with Children Ages 6 to 17 years Comparison
Immigrants from Bahamas
French
10.1%
UNEMPLOYMENT AMONG WOMEN WITH CHILDREN AGES 6 TO 17 YEARS
0.0/ 100
METRIC RATING
301st/ 347
METRIC RANK
9.7%
UNEMPLOYMENT AMONG WOMEN WITH CHILDREN AGES 6 TO 17 YEARS
0.1/ 100
METRIC RATING
278th/ 347
METRIC RANK
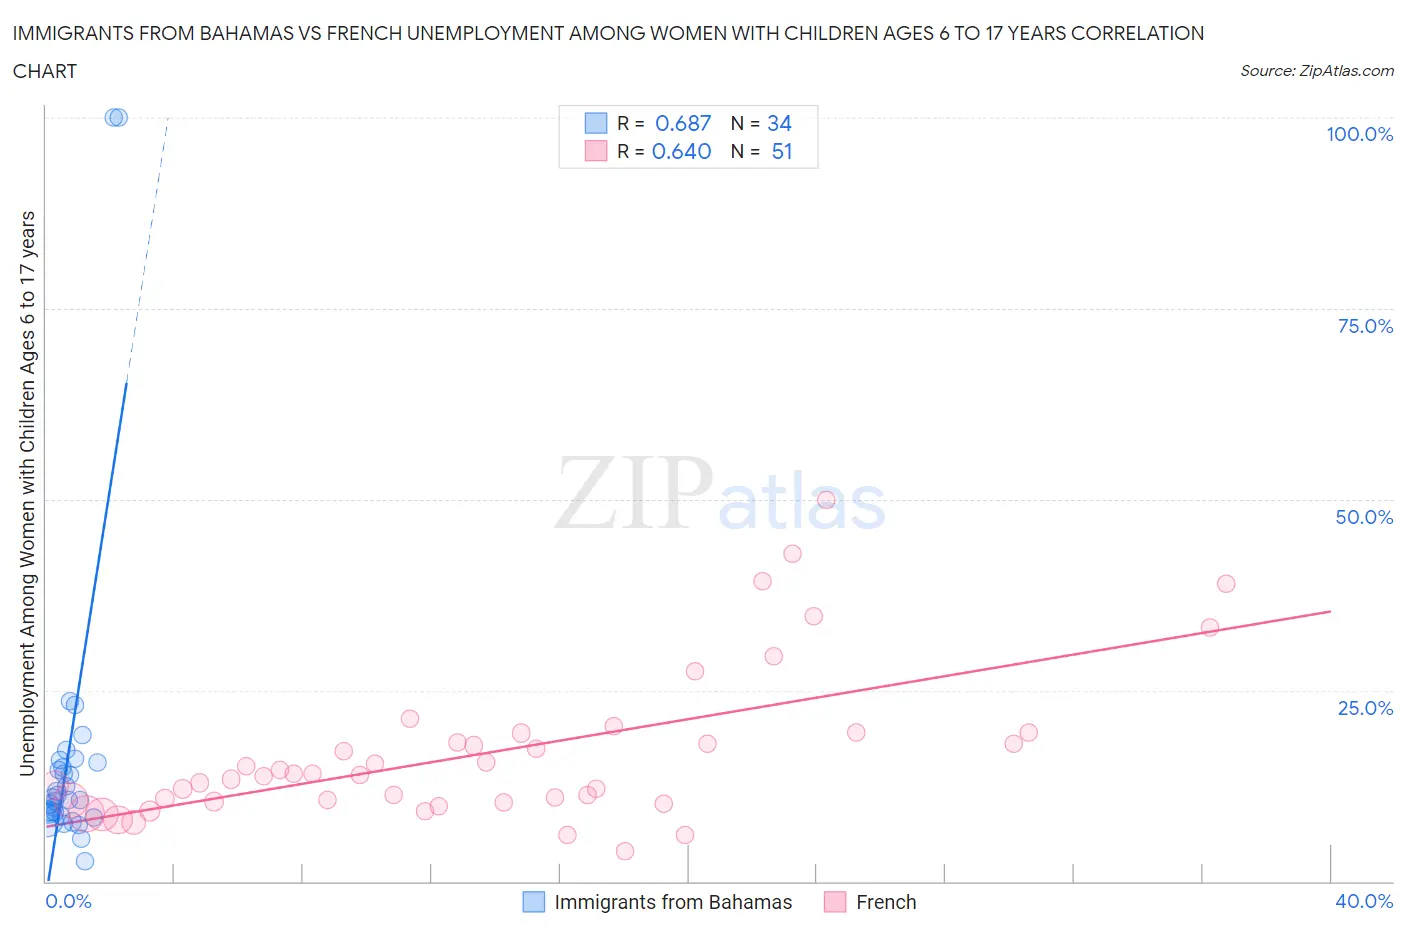
Immigrants from Bahamas vs French Unemployment Among Women with Children Ages 6 to 17 years Correlation Chart
The statistical analysis conducted on geographies consisting of 91,256,917 people shows a significant positive correlation between the proportion of Immigrants from Bahamas and unemployment rate among women with children between the ages 6 and 17 in the United States with a correlation coefficient (R) of 0.687 and weighted average of 10.1%. Similarly, the statistical analysis conducted on geographies consisting of 357,857,640 people shows a significant positive correlation between the proportion of French and unemployment rate among women with children between the ages 6 and 17 in the United States with a correlation coefficient (R) of 0.640 and weighted average of 9.7%, a difference of 4.3%.
Unemployment Among Women with Children Ages 6 to 17 years Correlation Summary
| Measurement | Immigrants from Bahamas | French |
| Minimum | 2.7% | 4.0% |
| Maximum | 100.0% | 49.9% |
| Range | 97.3% | 45.9% |
| Mean | 17.0% | 16.8% |
| Median | 10.8% | 13.8% |
| Interquartile 25% (IQ1) | 8.9% | 10.4% |
| Interquartile 75% (IQ3) | 15.5% | 19.4% |
| Interquartile Range (IQR) | 6.6% | 9.0% |
| Standard Deviation (Sample) | 21.5% | 10.0% |
| Standard Deviation (Population) | 21.2% | 9.9% |
Similar Demographics by Unemployment Among Women with Children Ages 6 to 17 years
Demographics Similar to Immigrants from Bahamas by Unemployment Among Women with Children Ages 6 to 17 years
In terms of unemployment among women with children ages 6 to 17 years, the demographic groups most similar to Immigrants from Bahamas are Nigerian (10.1%, a difference of 0.15%), Immigrants from Honduras (10.1%, a difference of 0.18%), Immigrants from Haiti (10.1%, a difference of 0.20%), Venezuelan (10.2%, a difference of 0.45%), and Immigrants from Caribbean (10.1%, a difference of 0.50%).
| Demographics | Rating | Rank | Unemployment Among Women with Children Ages 6 to 17 years |
| Ecuadorians | 0.0 /100 | #294 | Tragic 10.0% |
| Cherokee | 0.0 /100 | #295 | Tragic 10.0% |
| Immigrants | Western Africa | 0.0 /100 | #296 | Tragic 10.1% |
| Immigrants | Caribbean | 0.0 /100 | #297 | Tragic 10.1% |
| Immigrants | Haiti | 0.0 /100 | #298 | Tragic 10.1% |
| Immigrants | Honduras | 0.0 /100 | #299 | Tragic 10.1% |
| Nigerians | 0.0 /100 | #300 | Tragic 10.1% |
| Immigrants | Bahamas | 0.0 /100 | #301 | Tragic 10.1% |
| Venezuelans | 0.0 /100 | #302 | Tragic 10.2% |
| Immigrants | Ecuador | 0.0 /100 | #303 | Tragic 10.2% |
| Immigrants | Venezuela | 0.0 /100 | #304 | Tragic 10.2% |
| Immigrants | Nigeria | 0.0 /100 | #305 | Tragic 10.2% |
| Paraguayans | 0.0 /100 | #306 | Tragic 10.2% |
| Immigrants | Senegal | 0.0 /100 | #307 | Tragic 10.2% |
| Dutch West Indians | 0.0 /100 | #308 | Tragic 10.2% |
Demographics Similar to French by Unemployment Among Women with Children Ages 6 to 17 years
In terms of unemployment among women with children ages 6 to 17 years, the demographic groups most similar to French are Scotch-Irish (9.7%, a difference of 0.030%), British West Indian (9.7%, a difference of 0.070%), Immigrants from Portugal (9.7%, a difference of 0.12%), U.S. Virgin Islander (9.7%, a difference of 0.13%), and Seminole (9.7%, a difference of 0.22%).
| Demographics | Rating | Rank | Unemployment Among Women with Children Ages 6 to 17 years |
| Immigrants | Latin America | 0.1 /100 | #271 | Tragic 9.6% |
| Kiowa | 0.1 /100 | #272 | Tragic 9.6% |
| Whites/Caucasians | 0.1 /100 | #273 | Tragic 9.6% |
| Aleuts | 0.1 /100 | #274 | Tragic 9.6% |
| U.S. Virgin Islanders | 0.1 /100 | #275 | Tragic 9.7% |
| Immigrants | Portugal | 0.1 /100 | #276 | Tragic 9.7% |
| British West Indians | 0.1 /100 | #277 | Tragic 9.7% |
| French | 0.1 /100 | #278 | Tragic 9.7% |
| Scotch-Irish | 0.1 /100 | #279 | Tragic 9.7% |
| Seminole | 0.1 /100 | #280 | Tragic 9.7% |
| Jamaicans | 0.0 /100 | #281 | Tragic 9.8% |
| Slovaks | 0.0 /100 | #282 | Tragic 9.8% |
| Central American Indians | 0.0 /100 | #283 | Tragic 9.9% |
| Yakama | 0.0 /100 | #284 | Tragic 9.9% |
| Hispanics or Latinos | 0.0 /100 | #285 | Tragic 9.9% |