Eastern European vs Inupiat 2 or more Vehicles in Household
COMPARE
Eastern European
Inupiat
2 or more Vehicles in Household
2 or more Vehicles in Household Comparison
Eastern Europeans
Inupiat
54.8%
2 OR MORE VEHICLES IN HOUSEHOLD
27.5/ 100
METRIC RATING
189th/ 347
METRIC RANK
42.6%
2 OR MORE VEHICLES IN HOUSEHOLD
0.0/ 100
METRIC RATING
328th/ 347
METRIC RANK
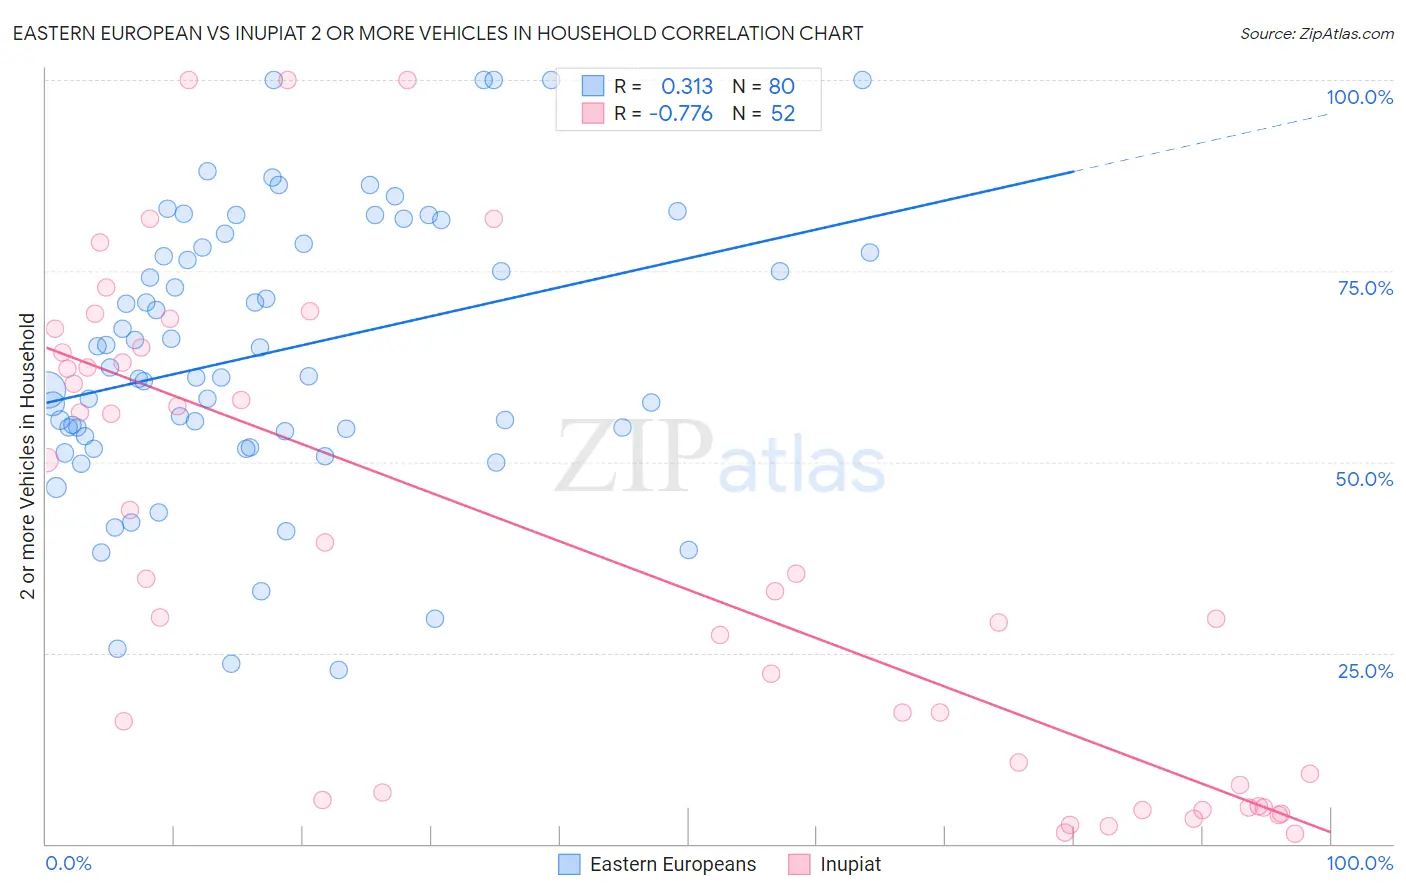
Eastern European vs Inupiat 2 or more Vehicles in Household Correlation Chart
The statistical analysis conducted on geographies consisting of 460,977,984 people shows a mild positive correlation between the proportion of Eastern Europeans and percentage of households with 2 or more vehicles available in the United States with a correlation coefficient (R) of 0.313 and weighted average of 54.8%. Similarly, the statistical analysis conducted on geographies consisting of 96,302,889 people shows a strong negative correlation between the proportion of Inupiat and percentage of households with 2 or more vehicles available in the United States with a correlation coefficient (R) of -0.776 and weighted average of 42.6%, a difference of 28.6%.
2 or more Vehicles in Household Correlation Summary
| Measurement | Eastern European | Inupiat |
| Minimum | 22.8% | 1.4% |
| Maximum | 100.0% | 100.0% |
| Range | 77.2% | 98.6% |
| Mean | 64.3% | 38.5% |
| Median | 61.9% | 33.9% |
| Interquartile 25% (IQ1) | 53.7% | 6.2% |
| Interquartile 75% (IQ3) | 78.3% | 63.7% |
| Interquartile Range (IQR) | 24.6% | 57.5% |
| Standard Deviation (Sample) | 18.3% | 30.7% |
| Standard Deviation (Population) | 18.2% | 30.4% |
Similar Demographics by 2 or more Vehicles in Household
Demographics Similar to Eastern Europeans by 2 or more Vehicles in Household
In terms of 2 or more vehicles in household, the demographic groups most similar to Eastern Europeans are Russian (54.8%, a difference of 0.060%), Immigrants (54.7%, a difference of 0.13%), Marshallese (54.9%, a difference of 0.15%), Immigrants from Romania (54.7%, a difference of 0.20%), and Immigrants from Japan (54.7%, a difference of 0.22%).
| Demographics | Rating | Rank | 2 or more Vehicles in Household |
| Cree | 38.2 /100 | #182 | Fair 55.1% |
| Immigrants | Cameroon | 37.3 /100 | #183 | Fair 55.1% |
| Apache | 36.7 /100 | #184 | Fair 55.1% |
| Arabs | 35.9 /100 | #185 | Fair 55.0% |
| Peruvians | 33.7 /100 | #186 | Fair 55.0% |
| Immigrants | Uganda | 33.4 /100 | #187 | Fair 55.0% |
| Marshallese | 30.5 /100 | #188 | Fair 54.9% |
| Eastern Europeans | 27.5 /100 | #189 | Fair 54.8% |
| Russians | 26.3 /100 | #190 | Fair 54.8% |
| Immigrants | Immigrants | 25.0 /100 | #191 | Fair 54.7% |
| Immigrants | Romania | 23.8 /100 | #192 | Fair 54.7% |
| Immigrants | Japan | 23.4 /100 | #193 | Fair 54.7% |
| Central Americans | 23.0 /100 | #194 | Fair 54.7% |
| Iroquois | 22.6 /100 | #195 | Fair 54.7% |
| Immigrants | Poland | 19.3 /100 | #196 | Poor 54.6% |
Demographics Similar to Inupiat by 2 or more Vehicles in Household
In terms of 2 or more vehicles in household, the demographic groups most similar to Inupiat are Immigrants from Yemen (42.8%, a difference of 0.50%), Immigrants from Senegal (43.0%, a difference of 0.91%), Immigrants from West Indies (43.1%, a difference of 1.1%), Ecuadorian (42.0%, a difference of 1.6%), and Immigrants from Cabo Verde (43.3%, a difference of 1.6%).
| Demographics | Rating | Rank | 2 or more Vehicles in Household |
| Immigrants | Jamaica | 0.0 /100 | #321 | Tragic 44.5% |
| Senegalese | 0.0 /100 | #322 | Tragic 44.2% |
| Immigrants | Caribbean | 0.0 /100 | #323 | Tragic 44.2% |
| Immigrants | Cabo Verde | 0.0 /100 | #324 | Tragic 43.3% |
| Immigrants | West Indies | 0.0 /100 | #325 | Tragic 43.1% |
| Immigrants | Senegal | 0.0 /100 | #326 | Tragic 43.0% |
| Immigrants | Yemen | 0.0 /100 | #327 | Tragic 42.8% |
| Inupiat | 0.0 /100 | #328 | Tragic 42.6% |
| Ecuadorians | 0.0 /100 | #329 | Tragic 42.0% |
| Immigrants | Dominica | 0.0 /100 | #330 | Tragic 41.6% |
| West Indians | 0.0 /100 | #331 | Tragic 41.3% |
| Trinidadians and Tobagonians | 0.0 /100 | #332 | Tragic 40.9% |
| Immigrants | Ecuador | 0.0 /100 | #333 | Tragic 40.5% |
| Immigrants | Trinidad and Tobago | 0.0 /100 | #334 | Tragic 40.3% |
| Immigrants | Bangladesh | 0.0 /100 | #335 | Tragic 38.8% |