Guamanian/Chamorro vs Inupiat 2 or more Vehicles in Household
COMPARE
Guamanian/Chamorro
Inupiat
2 or more Vehicles in Household
2 or more Vehicles in Household Comparison
Guamanians/Chamorros
Inupiat
60.5%
2 OR MORE VEHICLES IN HOUSEHOLD
100.0/ 100
METRIC RATING
28th/ 347
METRIC RANK
42.6%
2 OR MORE VEHICLES IN HOUSEHOLD
0.0/ 100
METRIC RATING
328th/ 347
METRIC RANK
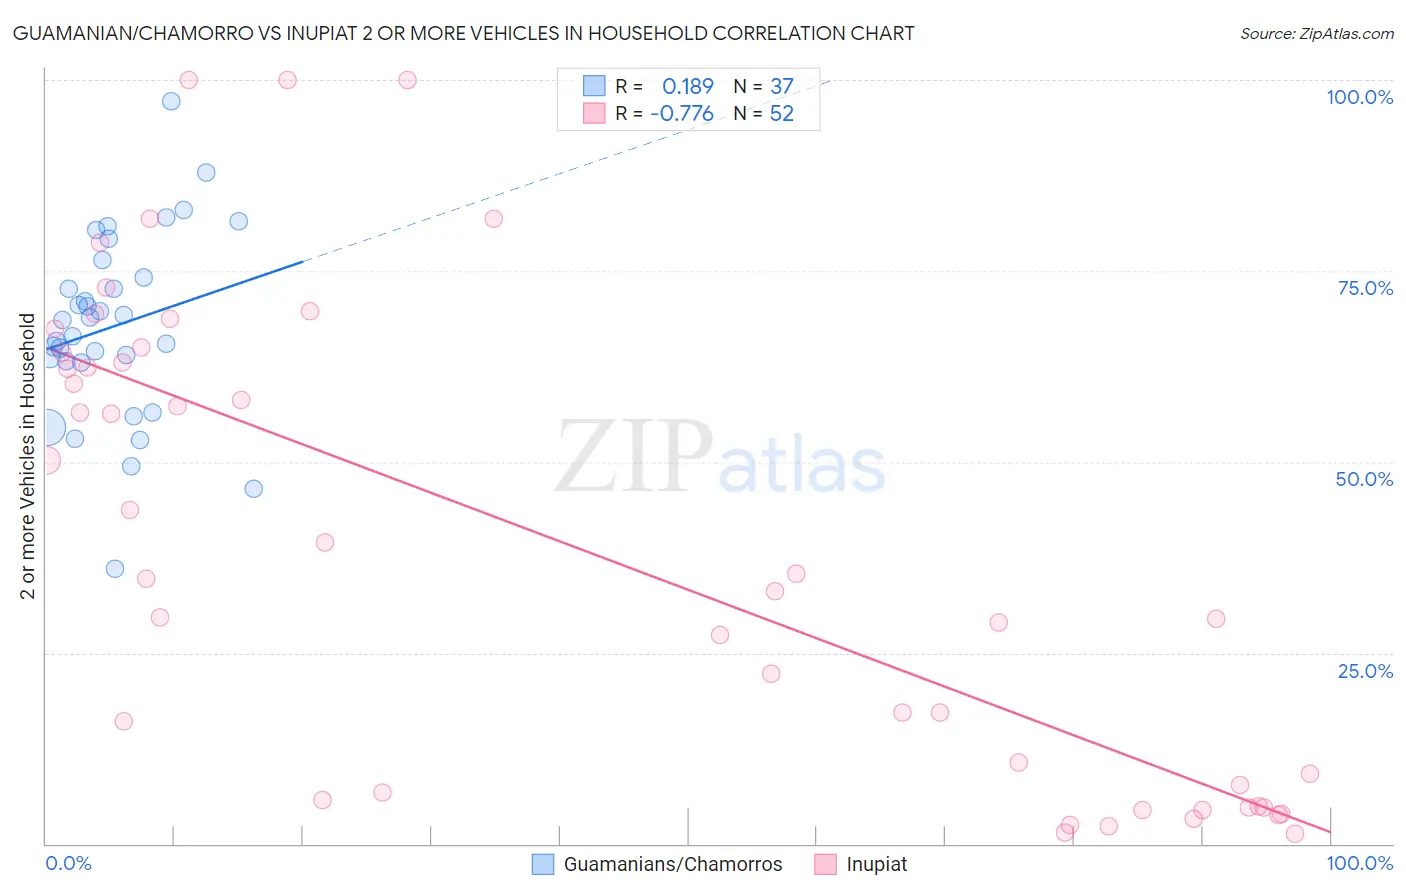
Guamanian/Chamorro vs Inupiat 2 or more Vehicles in Household Correlation Chart
The statistical analysis conducted on geographies consisting of 221,880,536 people shows a poor positive correlation between the proportion of Guamanians/Chamorros and percentage of households with 2 or more vehicles available in the United States with a correlation coefficient (R) of 0.189 and weighted average of 60.5%. Similarly, the statistical analysis conducted on geographies consisting of 96,302,889 people shows a strong negative correlation between the proportion of Inupiat and percentage of households with 2 or more vehicles available in the United States with a correlation coefficient (R) of -0.776 and weighted average of 42.6%, a difference of 41.8%.
2 or more Vehicles in Household Correlation Summary
| Measurement | Guamanian/Chamorro | Inupiat |
| Minimum | 36.1% | 1.4% |
| Maximum | 97.2% | 100.0% |
| Range | 61.2% | 98.6% |
| Mean | 67.8% | 38.5% |
| Median | 68.6% | 33.9% |
| Interquartile 25% (IQ1) | 63.0% | 6.2% |
| Interquartile 75% (IQ3) | 75.3% | 63.7% |
| Interquartile Range (IQR) | 12.3% | 57.5% |
| Standard Deviation (Sample) | 12.2% | 30.7% |
| Standard Deviation (Population) | 12.0% | 30.4% |
Similar Demographics by 2 or more Vehicles in Household
Demographics Similar to Guamanians/Chamorros by 2 or more Vehicles in Household
In terms of 2 or more vehicles in household, the demographic groups most similar to Guamanians/Chamorros are Hawaiian (60.4%, a difference of 0.11%), Assyrian/Chaldean/Syriac (60.5%, a difference of 0.13%), Finnish (60.3%, a difference of 0.24%), Spanish American Indian (60.3%, a difference of 0.26%), and Arapaho (60.2%, a difference of 0.37%).
| Demographics | Rating | Rank | 2 or more Vehicles in Household |
| Koreans | 100.0 /100 | #21 | Exceptional 61.0% |
| Swiss | 100.0 /100 | #22 | Exceptional 61.0% |
| Scotch-Irish | 100.0 /100 | #23 | Exceptional 60.9% |
| Immigrants | Vietnam | 100.0 /100 | #24 | Exceptional 60.9% |
| Whites/Caucasians | 100.0 /100 | #25 | Exceptional 60.8% |
| Welsh | 100.0 /100 | #26 | Exceptional 60.8% |
| Assyrians/Chaldeans/Syriacs | 100.0 /100 | #27 | Exceptional 60.5% |
| Guamanians/Chamorros | 100.0 /100 | #28 | Exceptional 60.5% |
| Hawaiians | 100.0 /100 | #29 | Exceptional 60.4% |
| Finns | 100.0 /100 | #30 | Exceptional 60.3% |
| Spanish American Indians | 100.0 /100 | #31 | Exceptional 60.3% |
| Arapaho | 100.0 /100 | #32 | Exceptional 60.2% |
| Immigrants | Mexico | 100.0 /100 | #33 | Exceptional 60.2% |
| Spanish | 100.0 /100 | #34 | Exceptional 60.2% |
| Immigrants | Philippines | 100.0 /100 | #35 | Exceptional 60.1% |
Demographics Similar to Inupiat by 2 or more Vehicles in Household
In terms of 2 or more vehicles in household, the demographic groups most similar to Inupiat are Immigrants from Yemen (42.8%, a difference of 0.50%), Immigrants from Senegal (43.0%, a difference of 0.91%), Immigrants from West Indies (43.1%, a difference of 1.1%), Ecuadorian (42.0%, a difference of 1.6%), and Immigrants from Cabo Verde (43.3%, a difference of 1.6%).
| Demographics | Rating | Rank | 2 or more Vehicles in Household |
| Immigrants | Jamaica | 0.0 /100 | #321 | Tragic 44.5% |
| Senegalese | 0.0 /100 | #322 | Tragic 44.2% |
| Immigrants | Caribbean | 0.0 /100 | #323 | Tragic 44.2% |
| Immigrants | Cabo Verde | 0.0 /100 | #324 | Tragic 43.3% |
| Immigrants | West Indies | 0.0 /100 | #325 | Tragic 43.1% |
| Immigrants | Senegal | 0.0 /100 | #326 | Tragic 43.0% |
| Immigrants | Yemen | 0.0 /100 | #327 | Tragic 42.8% |
| Inupiat | 0.0 /100 | #328 | Tragic 42.6% |
| Ecuadorians | 0.0 /100 | #329 | Tragic 42.0% |
| Immigrants | Dominica | 0.0 /100 | #330 | Tragic 41.6% |
| West Indians | 0.0 /100 | #331 | Tragic 41.3% |
| Trinidadians and Tobagonians | 0.0 /100 | #332 | Tragic 40.9% |
| Immigrants | Ecuador | 0.0 /100 | #333 | Tragic 40.5% |
| Immigrants | Trinidad and Tobago | 0.0 /100 | #334 | Tragic 40.3% |
| Immigrants | Bangladesh | 0.0 /100 | #335 | Tragic 38.8% |