Immigrants from Armenia vs Immigrants from West Indies College, 1 year or more
COMPARE
Immigrants from Armenia
Immigrants from West Indies
College, 1 year or more
College, 1 year or more Comparison
Immigrants from Armenia
Immigrants from West Indies
60.0%
COLLEGE, 1 YEAR OR MORE
68.8/ 100
METRIC RATING
157th/ 347
METRIC RANK
55.2%
COLLEGE, 1 YEAR OR MORE
0.5/ 100
METRIC RATING
256th/ 347
METRIC RANK
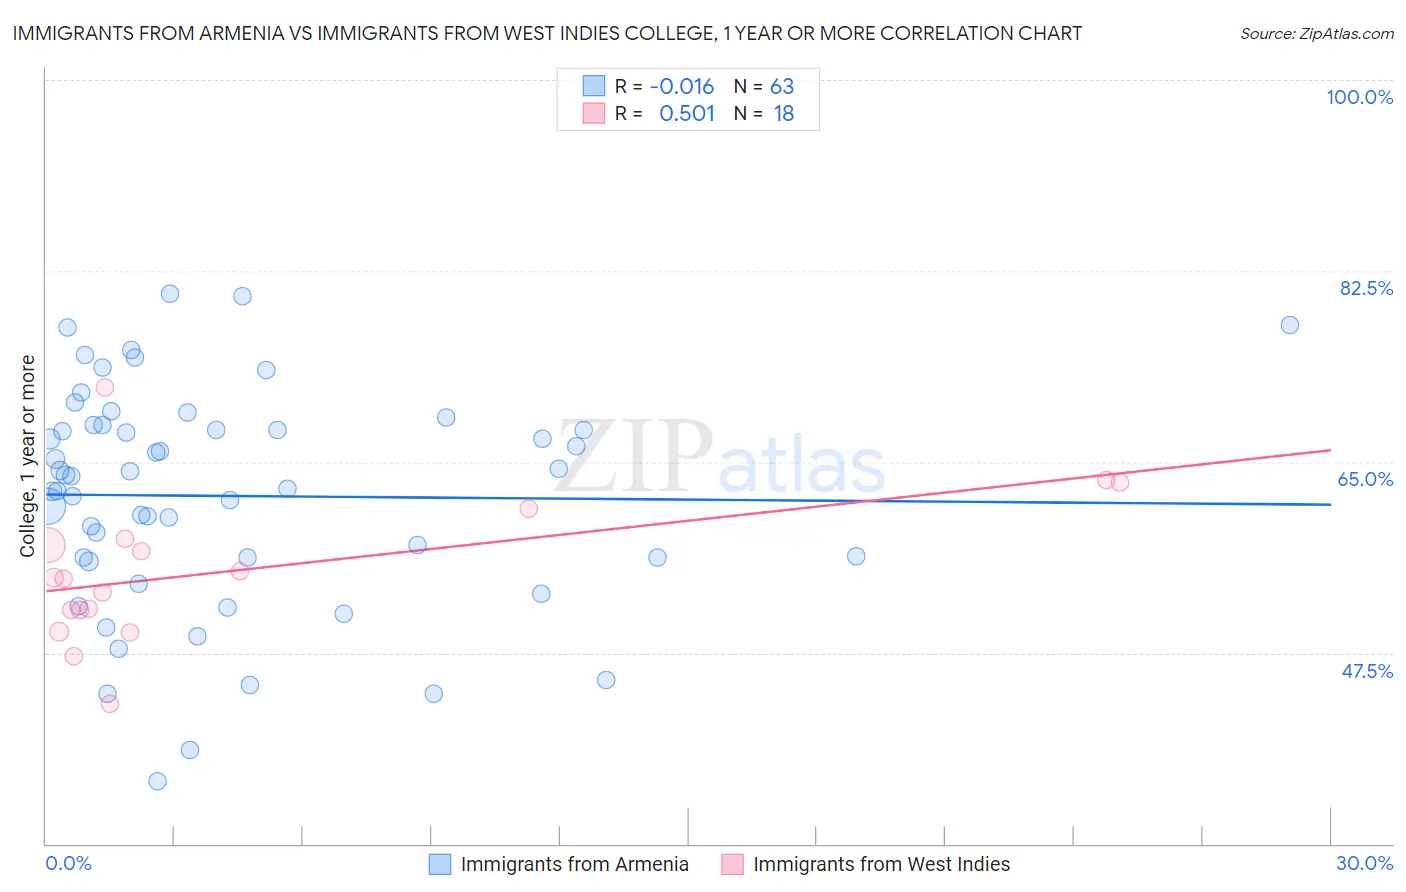
Immigrants from Armenia vs Immigrants from West Indies College, 1 year or more Correlation Chart
The statistical analysis conducted on geographies consisting of 97,725,183 people shows no correlation between the proportion of Immigrants from Armenia and percentage of population with at least college, 1 year or more education in the United States with a correlation coefficient (R) of -0.016 and weighted average of 60.0%. Similarly, the statistical analysis conducted on geographies consisting of 72,420,477 people shows a substantial positive correlation between the proportion of Immigrants from West Indies and percentage of population with at least college, 1 year or more education in the United States with a correlation coefficient (R) of 0.501 and weighted average of 55.2%, a difference of 8.8%.
College, 1 year or more Correlation Summary
| Measurement | Immigrants from Armenia | Immigrants from West Indies |
| Minimum | 35.7% | 42.9% |
| Maximum | 80.4% | 71.8% |
| Range | 44.7% | 28.9% |
| Mean | 61.9% | 55.1% |
| Median | 63.7% | 54.3% |
| Interquartile 25% (IQ1) | 56.2% | 51.4% |
| Interquartile 75% (IQ3) | 68.3% | 58.0% |
| Interquartile Range (IQR) | 12.2% | 6.6% |
| Standard Deviation (Sample) | 10.1% | 6.8% |
| Standard Deviation (Population) | 10.0% | 6.6% |
Similar Demographics by College, 1 year or more
Demographics Similar to Immigrants from Armenia by College, 1 year or more
In terms of college, 1 year or more, the demographic groups most similar to Immigrants from Armenia are English (60.0%, a difference of 0.10%), Immigrants from Iraq (60.0%, a difference of 0.11%), South American Indian (60.0%, a difference of 0.12%), Somali (59.9%, a difference of 0.25%), and Sudanese (60.2%, a difference of 0.26%).
| Demographics | Rating | Rank | College, 1 year or more |
| Immigrants | Sudan | 77.8 /100 | #150 | Good 60.4% |
| Albanians | 77.8 /100 | #151 | Good 60.4% |
| Immigrants | Germany | 76.1 /100 | #152 | Good 60.3% |
| Sierra Leoneans | 74.1 /100 | #153 | Good 60.2% |
| Sudanese | 73.0 /100 | #154 | Good 60.2% |
| Moroccans | 72.9 /100 | #155 | Good 60.2% |
| Finns | 72.9 /100 | #156 | Good 60.2% |
| Immigrants | Armenia | 68.8 /100 | #157 | Good 60.0% |
| English | 67.2 /100 | #158 | Good 60.0% |
| Immigrants | Iraq | 67.0 /100 | #159 | Good 60.0% |
| South American Indians | 66.9 /100 | #160 | Good 60.0% |
| Somalis | 64.5 /100 | #161 | Good 59.9% |
| Koreans | 58.5 /100 | #162 | Average 59.7% |
| Immigrants | Somalia | 58.3 /100 | #163 | Average 59.7% |
| Belgians | 58.1 /100 | #164 | Average 59.7% |
Demographics Similar to Immigrants from West Indies by College, 1 year or more
In terms of college, 1 year or more, the demographic groups most similar to Immigrants from West Indies are Immigrants from Bahamas (55.2%, a difference of 0.080%), Indonesian (55.1%, a difference of 0.10%), Japanese (55.2%, a difference of 0.12%), Immigrants from Barbados (55.4%, a difference of 0.38%), and African (55.0%, a difference of 0.38%).
| Demographics | Rating | Rank | College, 1 year or more |
| Immigrants | Trinidad and Tobago | 0.7 /100 | #249 | Tragic 55.5% |
| Delaware | 0.7 /100 | #250 | Tragic 55.5% |
| Immigrants | Cambodia | 0.6 /100 | #251 | Tragic 55.4% |
| Aleuts | 0.6 /100 | #252 | Tragic 55.4% |
| Immigrants | Barbados | 0.6 /100 | #253 | Tragic 55.4% |
| Japanese | 0.5 /100 | #254 | Tragic 55.2% |
| Immigrants | Bahamas | 0.5 /100 | #255 | Tragic 55.2% |
| Immigrants | West Indies | 0.5 /100 | #256 | Tragic 55.2% |
| Indonesians | 0.4 /100 | #257 | Tragic 55.1% |
| Africans | 0.4 /100 | #258 | Tragic 55.0% |
| Nepalese | 0.3 /100 | #259 | Tragic 54.9% |
| Jamaicans | 0.3 /100 | #260 | Tragic 54.9% |
| Ottawa | 0.3 /100 | #261 | Tragic 54.9% |
| Immigrants | St. Vincent and the Grenadines | 0.3 /100 | #262 | Tragic 54.8% |
| U.S. Virgin Islanders | 0.3 /100 | #263 | Tragic 54.8% |