Luxembourger vs Italian 2 or more Vehicles in Household
COMPARE
Luxembourger
Italian
2 or more Vehicles in Household
2 or more Vehicles in Household Comparison
Luxembourgers
Italians
59.1%
2 OR MORE VEHICLES IN HOUSEHOLD
99.9/ 100
METRIC RATING
55th/ 347
METRIC RANK
58.4%
2 OR MORE VEHICLES IN HOUSEHOLD
99.6/ 100
METRIC RATING
70th/ 347
METRIC RANK
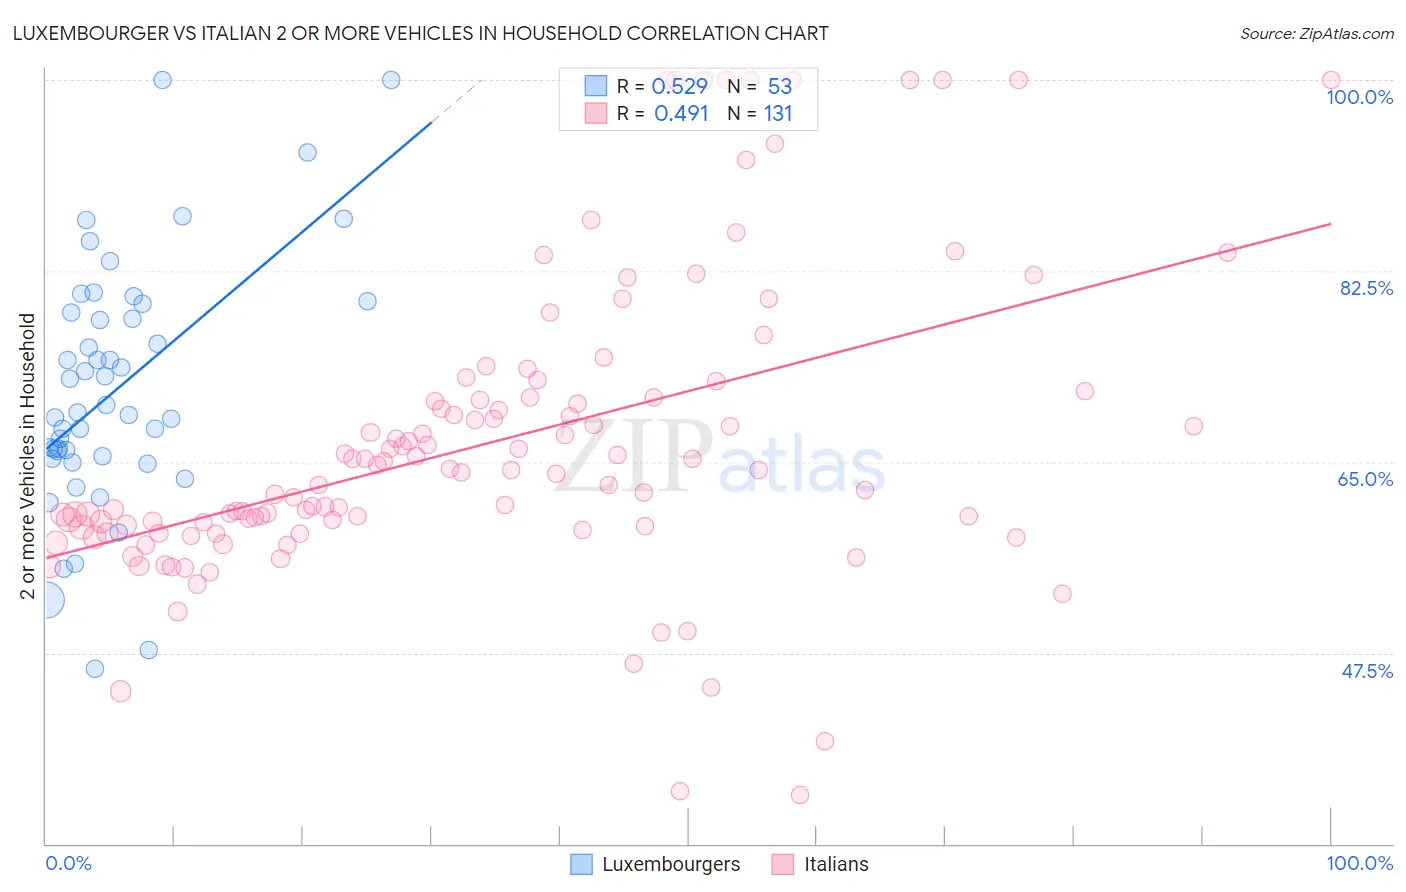
Luxembourger vs Italian 2 or more Vehicles in Household Correlation Chart
The statistical analysis conducted on geographies consisting of 144,657,746 people shows a substantial positive correlation between the proportion of Luxembourgers and percentage of households with 2 or more vehicles available in the United States with a correlation coefficient (R) of 0.529 and weighted average of 59.1%. Similarly, the statistical analysis conducted on geographies consisting of 574,514,486 people shows a moderate positive correlation between the proportion of Italians and percentage of households with 2 or more vehicles available in the United States with a correlation coefficient (R) of 0.491 and weighted average of 58.4%, a difference of 1.1%.
2 or more Vehicles in Household Correlation Summary
| Measurement | Luxembourger | Italian |
| Minimum | 46.0% | 34.5% |
| Maximum | 100.0% | 100.0% |
| Range | 54.0% | 65.5% |
| Mean | 71.7% | 66.7% |
| Median | 69.5% | 64.0% |
| Interquartile 25% (IQ1) | 65.4% | 59.0% |
| Interquartile 75% (IQ3) | 79.1% | 70.9% |
| Interquartile Range (IQR) | 13.7% | 11.9% |
| Standard Deviation (Sample) | 11.4% | 13.8% |
| Standard Deviation (Population) | 11.3% | 13.7% |
Demographics Similar to Luxembourgers and Italians by 2 or more Vehicles in Household
In terms of 2 or more vehicles in household, the demographic groups most similar to Luxembourgers are Bhutanese (59.1%, a difference of 0.030%), Chickasaw (59.0%, a difference of 0.11%), Afghan (59.0%, a difference of 0.11%), Celtic (59.2%, a difference of 0.18%), and Immigrants from Laos (59.2%, a difference of 0.19%). Similarly, the demographic groups most similar to Italians are Bangladeshi (58.4%, a difference of 0.020%), Austrian (58.4%, a difference of 0.050%), Pennsylvania German (58.5%, a difference of 0.11%), Canadian (58.6%, a difference of 0.24%), and Laotian (58.6%, a difference of 0.25%).
| Demographics | Rating | Rank | 2 or more Vehicles in Household |
| Immigrants | Laos | 99.9 /100 | #52 | Exceptional 59.2% |
| Celtics | 99.9 /100 | #53 | Exceptional 59.2% |
| Bhutanese | 99.9 /100 | #54 | Exceptional 59.1% |
| Luxembourgers | 99.9 /100 | #55 | Exceptional 59.1% |
| Chickasaw | 99.9 /100 | #56 | Exceptional 59.0% |
| Afghans | 99.9 /100 | #57 | Exceptional 59.0% |
| Immigrants | Scotland | 99.8 /100 | #58 | Exceptional 58.9% |
| Spanish Americans | 99.8 /100 | #59 | Exceptional 58.9% |
| French Canadians | 99.8 /100 | #60 | Exceptional 58.9% |
| Osage | 99.8 /100 | #61 | Exceptional 58.8% |
| Immigrants | Nonimmigrants | 99.8 /100 | #62 | Exceptional 58.8% |
| Mexican American Indians | 99.8 /100 | #63 | Exceptional 58.7% |
| Portuguese | 99.7 /100 | #64 | Exceptional 58.6% |
| Immigrants | Central America | 99.7 /100 | #65 | Exceptional 58.6% |
| Croatians | 99.7 /100 | #66 | Exceptional 58.6% |
| Laotians | 99.7 /100 | #67 | Exceptional 58.6% |
| Canadians | 99.7 /100 | #68 | Exceptional 58.6% |
| Pennsylvania Germans | 99.7 /100 | #69 | Exceptional 58.5% |
| Italians | 99.6 /100 | #70 | Exceptional 58.4% |
| Bangladeshis | 99.6 /100 | #71 | Exceptional 58.4% |
| Austrians | 99.6 /100 | #72 | Exceptional 58.4% |