Immigrants from Guatemala vs Japanese 1 or more Vehicles in Household
COMPARE
Immigrants from Guatemala
Japanese
1 or more Vehicles in Household
1 or more Vehicles in Household Comparison
Immigrants from Guatemala
Japanese
88.9%
1 OR MORE VEHICLES IN HOUSEHOLD
8.6/ 100
METRIC RATING
219th/ 347
METRIC RANK
90.6%
1 OR MORE VEHICLES IN HOUSEHOLD
93.4/ 100
METRIC RATING
118th/ 347
METRIC RANK
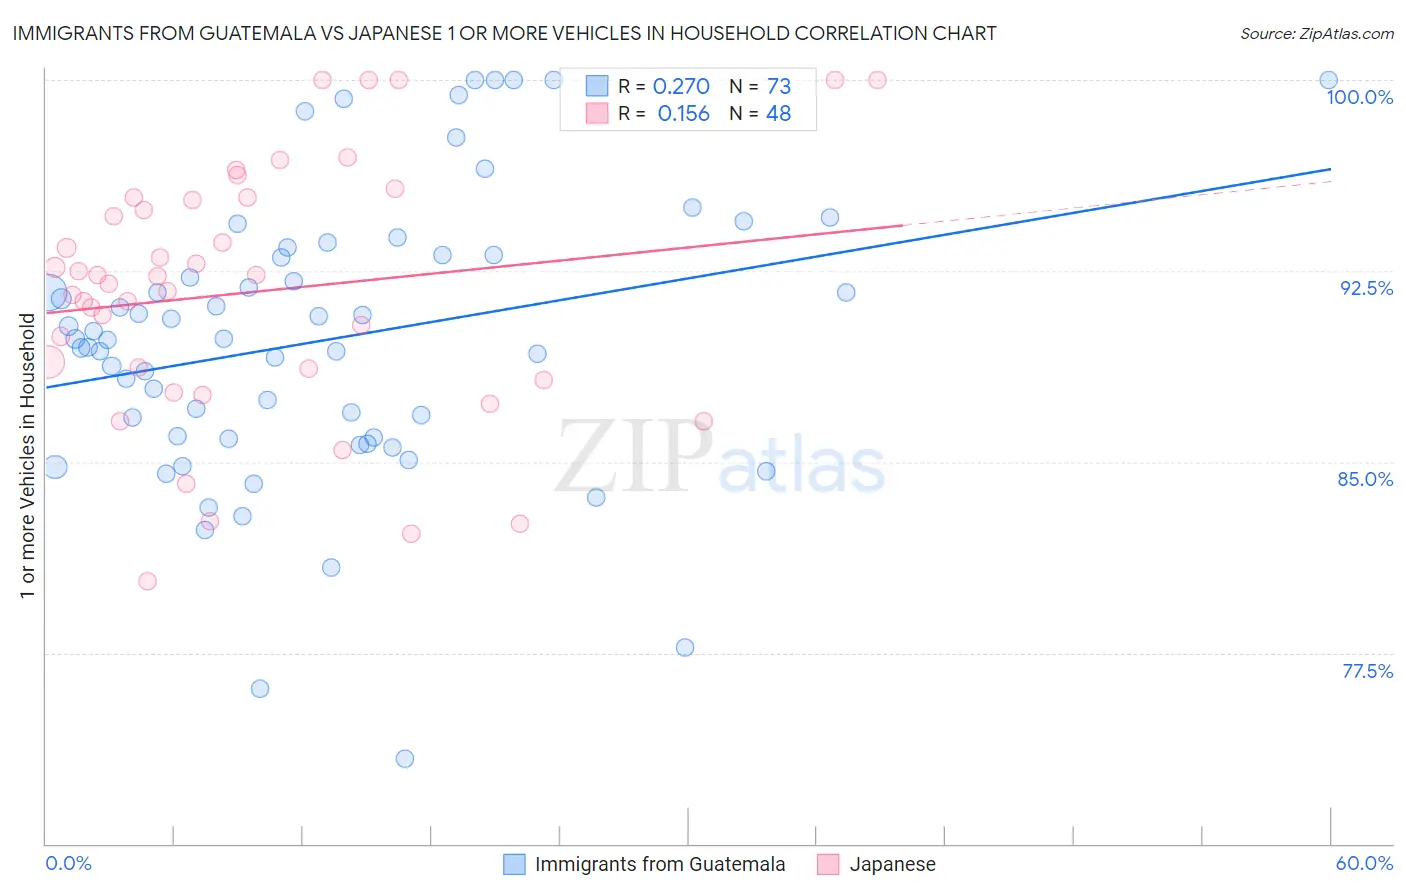
Immigrants from Guatemala vs Japanese 1 or more Vehicles in Household Correlation Chart
The statistical analysis conducted on geographies consisting of 377,136,668 people shows a weak positive correlation between the proportion of Immigrants from Guatemala and percentage of households with 1 or more vehicles available in the United States with a correlation coefficient (R) of 0.270 and weighted average of 88.9%. Similarly, the statistical analysis conducted on geographies consisting of 249,114,886 people shows a poor positive correlation between the proportion of Japanese and percentage of households with 1 or more vehicles available in the United States with a correlation coefficient (R) of 0.156 and weighted average of 90.6%, a difference of 2.0%.
1 or more Vehicles in Household Correlation Summary
| Measurement | Immigrants from Guatemala | Japanese |
| Minimum | 73.4% | 80.3% |
| Maximum | 100.0% | 100.0% |
| Range | 26.6% | 19.7% |
| Mean | 89.8% | 91.7% |
| Median | 89.8% | 92.1% |
| Interquartile 25% (IQ1) | 85.9% | 88.4% |
| Interquartile 75% (IQ3) | 93.1% | 95.3% |
| Interquartile Range (IQR) | 7.2% | 6.9% |
| Standard Deviation (Sample) | 5.6% | 5.0% |
| Standard Deviation (Population) | 5.6% | 4.9% |
Similar Demographics by 1 or more Vehicles in Household
Demographics Similar to Immigrants from Guatemala by 1 or more Vehicles in Household
In terms of 1 or more vehicles in household, the demographic groups most similar to Immigrants from Guatemala are Ugandan (88.9%, a difference of 0.0%), Argentinean (88.9%, a difference of 0.010%), Immigrants from Zaire (88.8%, a difference of 0.030%), Immigrants from Argentina (88.9%, a difference of 0.040%), and Peruvian (88.8%, a difference of 0.040%).
| Demographics | Rating | Rank | 1 or more Vehicles in Household |
| Somalis | 12.8 /100 | #212 | Poor 89.0% |
| Immigrants | Western Asia | 12.3 /100 | #213 | Poor 89.0% |
| Immigrants | Hungary | 11.9 /100 | #214 | Poor 89.0% |
| Immigrants | Sri Lanka | 10.2 /100 | #215 | Poor 88.9% |
| Immigrants | Argentina | 9.4 /100 | #216 | Tragic 88.9% |
| Argentineans | 8.8 /100 | #217 | Tragic 88.9% |
| Ugandans | 8.7 /100 | #218 | Tragic 88.9% |
| Immigrants | Guatemala | 8.6 /100 | #219 | Tragic 88.9% |
| Immigrants | Zaire | 8.1 /100 | #220 | Tragic 88.8% |
| Peruvians | 7.9 /100 | #221 | Tragic 88.8% |
| Uruguayans | 7.0 /100 | #222 | Tragic 88.8% |
| Immigrants | South America | 7.0 /100 | #223 | Tragic 88.8% |
| Immigrants | Hong Kong | 6.2 /100 | #224 | Tragic 88.7% |
| Cree | 6.0 /100 | #225 | Tragic 88.7% |
| Cheyenne | 5.7 /100 | #226 | Tragic 88.7% |
Demographics Similar to Japanese by 1 or more Vehicles in Household
In terms of 1 or more vehicles in household, the demographic groups most similar to Japanese are Greek (90.6%, a difference of 0.010%), Blackfeet (90.6%, a difference of 0.050%), Serbian (90.7%, a difference of 0.060%), Chippewa (90.7%, a difference of 0.060%), and Immigrants from Thailand (90.6%, a difference of 0.070%).
| Demographics | Rating | Rank | 1 or more Vehicles in Household |
| Navajo | 95.8 /100 | #111 | Exceptional 90.8% |
| Immigrants | Netherlands | 95.7 /100 | #112 | Exceptional 90.8% |
| Immigrants | Kuwait | 94.7 /100 | #113 | Exceptional 90.7% |
| Armenians | 94.5 /100 | #114 | Exceptional 90.7% |
| Serbians | 94.3 /100 | #115 | Exceptional 90.7% |
| Chippewa | 94.3 /100 | #116 | Exceptional 90.7% |
| Greeks | 93.5 /100 | #117 | Exceptional 90.6% |
| Japanese | 93.4 /100 | #118 | Exceptional 90.6% |
| Blackfeet | 92.6 /100 | #119 | Exceptional 90.6% |
| Immigrants | Thailand | 92.3 /100 | #120 | Exceptional 90.6% |
| Icelanders | 92.1 /100 | #121 | Exceptional 90.5% |
| Costa Ricans | 92.0 /100 | #122 | Exceptional 90.5% |
| Fijians | 91.8 /100 | #123 | Exceptional 90.5% |
| Puget Sound Salish | 91.5 /100 | #124 | Exceptional 90.5% |
| Immigrants | Korea | 90.5 /100 | #125 | Exceptional 90.5% |