Hawaiian vs Immigrants from Burma/Myanmar 2 or more Vehicles in Household
COMPARE
Hawaiian
Immigrants from Burma/Myanmar
2 or more Vehicles in Household
2 or more Vehicles in Household Comparison
Hawaiians
Immigrants from Burma/Myanmar
60.4%
2 OR MORE VEHICLES IN HOUSEHOLD
100.0/ 100
METRIC RATING
29th/ 347
METRIC RANK
53.9%
2 OR MORE VEHICLES IN HOUSEHOLD
7.1/ 100
METRIC RATING
217th/ 347
METRIC RANK
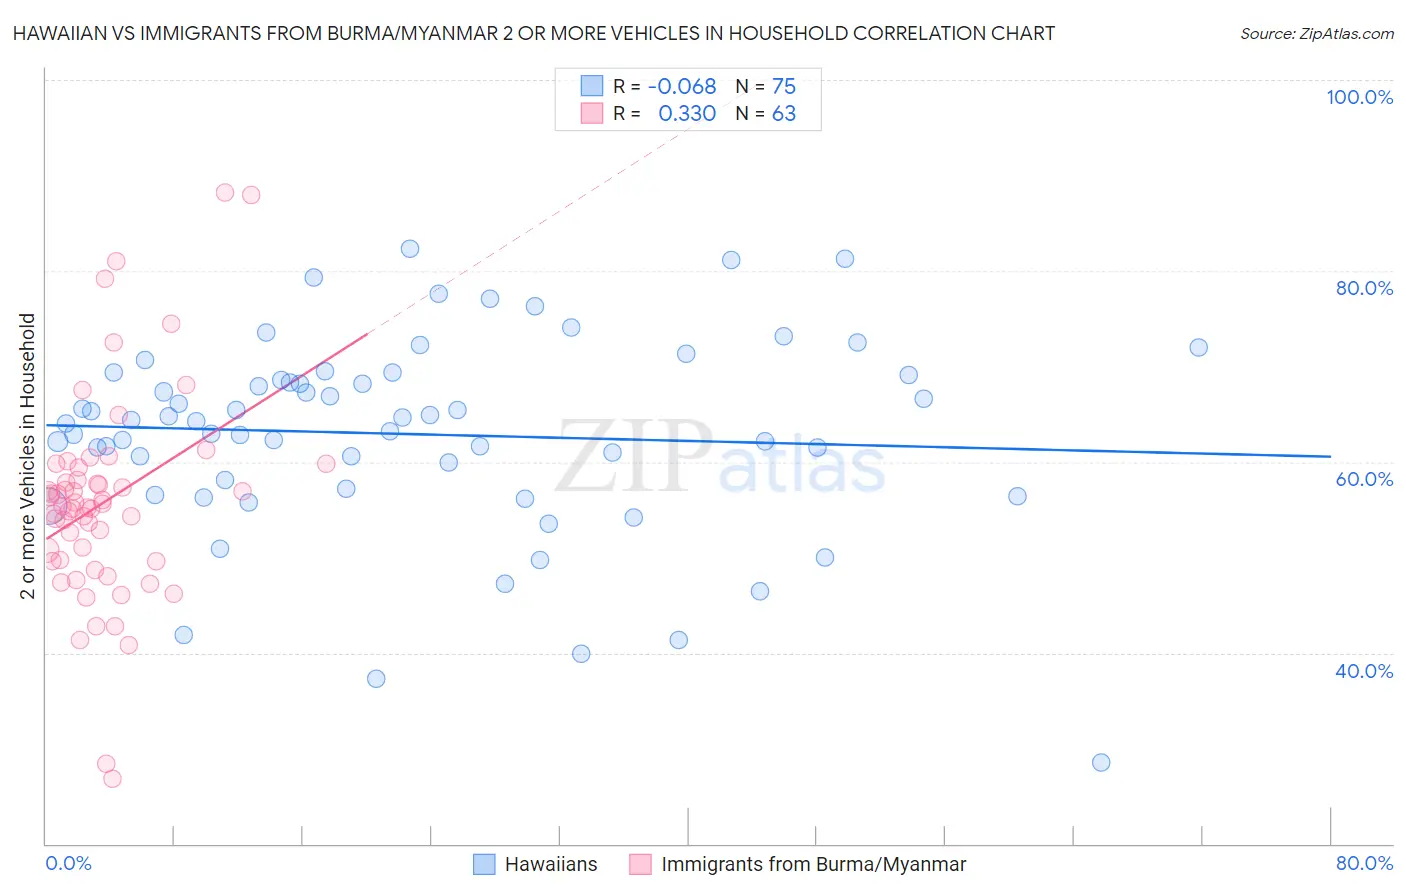
Hawaiian vs Immigrants from Burma/Myanmar 2 or more Vehicles in Household Correlation Chart
The statistical analysis conducted on geographies consisting of 327,414,018 people shows a slight negative correlation between the proportion of Hawaiians and percentage of households with 2 or more vehicles available in the United States with a correlation coefficient (R) of -0.068 and weighted average of 60.4%. Similarly, the statistical analysis conducted on geographies consisting of 172,281,201 people shows a mild positive correlation between the proportion of Immigrants from Burma/Myanmar and percentage of households with 2 or more vehicles available in the United States with a correlation coefficient (R) of 0.330 and weighted average of 53.9%, a difference of 12.0%.
2 or more Vehicles in Household Correlation Summary
| Measurement | Hawaiian | Immigrants from Burma/Myanmar |
| Minimum | 28.6% | 26.8% |
| Maximum | 82.3% | 88.2% |
| Range | 53.7% | 61.4% |
| Mean | 62.9% | 55.8% |
| Median | 64.3% | 55.3% |
| Interquartile 25% (IQ1) | 57.2% | 49.6% |
| Interquartile 75% (IQ3) | 69.1% | 59.4% |
| Interquartile Range (IQR) | 11.8% | 9.8% |
| Standard Deviation (Sample) | 10.3% | 11.1% |
| Standard Deviation (Population) | 10.3% | 11.0% |
Similar Demographics by 2 or more Vehicles in Household
Demographics Similar to Hawaiians by 2 or more Vehicles in Household
In terms of 2 or more vehicles in household, the demographic groups most similar to Hawaiians are Guamanian/Chamorro (60.5%, a difference of 0.11%), Finnish (60.3%, a difference of 0.13%), Spanish American Indian (60.3%, a difference of 0.16%), Assyrian/Chaldean/Syriac (60.5%, a difference of 0.23%), and Arapaho (60.2%, a difference of 0.26%).
| Demographics | Rating | Rank | 2 or more Vehicles in Household |
| Swiss | 100.0 /100 | #22 | Exceptional 61.0% |
| Scotch-Irish | 100.0 /100 | #23 | Exceptional 60.9% |
| Immigrants | Vietnam | 100.0 /100 | #24 | Exceptional 60.9% |
| Whites/Caucasians | 100.0 /100 | #25 | Exceptional 60.8% |
| Welsh | 100.0 /100 | #26 | Exceptional 60.8% |
| Assyrians/Chaldeans/Syriacs | 100.0 /100 | #27 | Exceptional 60.5% |
| Guamanians/Chamorros | 100.0 /100 | #28 | Exceptional 60.5% |
| Hawaiians | 100.0 /100 | #29 | Exceptional 60.4% |
| Finns | 100.0 /100 | #30 | Exceptional 60.3% |
| Spanish American Indians | 100.0 /100 | #31 | Exceptional 60.3% |
| Arapaho | 100.0 /100 | #32 | Exceptional 60.2% |
| Immigrants | Mexico | 100.0 /100 | #33 | Exceptional 60.2% |
| Spanish | 100.0 /100 | #34 | Exceptional 60.2% |
| Immigrants | Philippines | 100.0 /100 | #35 | Exceptional 60.1% |
| Chinese | 100.0 /100 | #36 | Exceptional 60.1% |
Demographics Similar to Immigrants from Burma/Myanmar by 2 or more Vehicles in Household
In terms of 2 or more vehicles in household, the demographic groups most similar to Immigrants from Burma/Myanmar are Immigrants from Argentina (53.9%, a difference of 0.050%), South American Indian (53.9%, a difference of 0.11%), Taiwanese (53.9%, a difference of 0.13%), Immigrants from Singapore (53.9%, a difference of 0.14%), and Kiowa (53.9%, a difference of 0.16%).
| Demographics | Rating | Rank | 2 or more Vehicles in Household |
| Immigrants | Saudi Arabia | 11.3 /100 | #210 | Poor 54.2% |
| Immigrants | Hungary | 11.3 /100 | #211 | Poor 54.2% |
| Immigrants | Chile | 11.1 /100 | #212 | Poor 54.2% |
| Guatemalans | 9.6 /100 | #213 | Tragic 54.1% |
| Immigrants | Czechoslovakia | 9.4 /100 | #214 | Tragic 54.1% |
| Aleuts | 9.3 /100 | #215 | Tragic 54.1% |
| Immigrants | Western Asia | 9.3 /100 | #216 | Tragic 54.1% |
| Immigrants | Burma/Myanmar | 7.1 /100 | #217 | Tragic 53.9% |
| Immigrants | Argentina | 6.8 /100 | #218 | Tragic 53.9% |
| South American Indians | 6.5 /100 | #219 | Tragic 53.9% |
| Taiwanese | 6.3 /100 | #220 | Tragic 53.9% |
| Immigrants | Singapore | 6.3 /100 | #221 | Tragic 53.9% |
| Kiowa | 6.2 /100 | #222 | Tragic 53.9% |
| Immigrants | Bosnia and Herzegovina | 5.5 /100 | #223 | Tragic 53.8% |
| Brazilians | 5.3 /100 | #224 | Tragic 53.8% |