Hawaiian vs Immigrants from Portugal 2 or more Vehicles in Household
COMPARE
Hawaiian
Immigrants from Portugal
2 or more Vehicles in Household
2 or more Vehicles in Household Comparison
Hawaiians
Immigrants from Portugal
60.4%
2 OR MORE VEHICLES IN HOUSEHOLD
100.0/ 100
METRIC RATING
29th/ 347
METRIC RANK
52.8%
2 OR MORE VEHICLES IN HOUSEHOLD
1.0/ 100
METRIC RATING
252nd/ 347
METRIC RANK
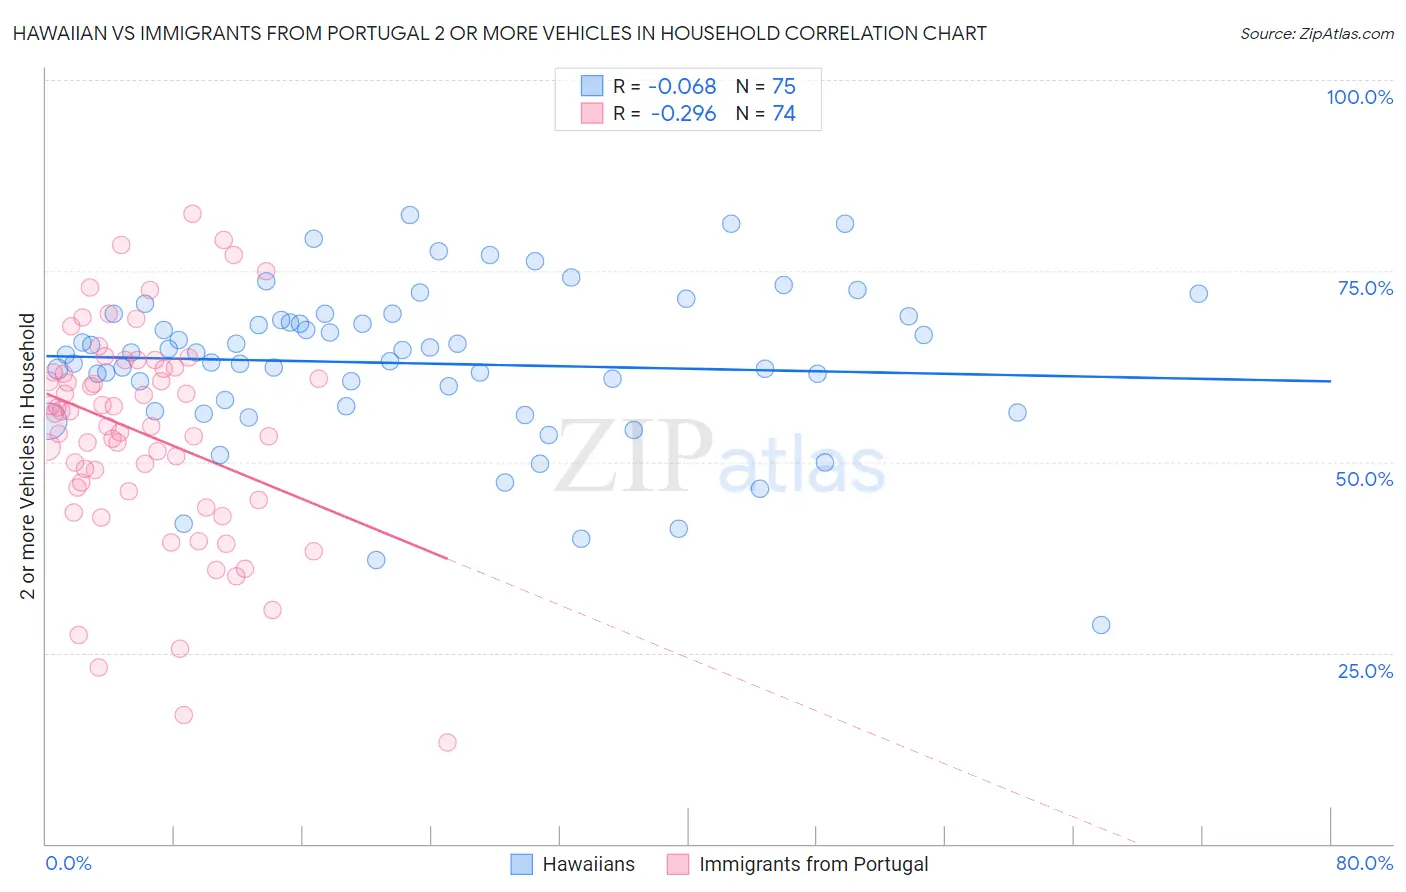
Hawaiian vs Immigrants from Portugal 2 or more Vehicles in Household Correlation Chart
The statistical analysis conducted on geographies consisting of 327,414,018 people shows a slight negative correlation between the proportion of Hawaiians and percentage of households with 2 or more vehicles available in the United States with a correlation coefficient (R) of -0.068 and weighted average of 60.4%. Similarly, the statistical analysis conducted on geographies consisting of 174,767,026 people shows a weak negative correlation between the proportion of Immigrants from Portugal and percentage of households with 2 or more vehicles available in the United States with a correlation coefficient (R) of -0.296 and weighted average of 52.8%, a difference of 14.4%.
2 or more Vehicles in Household Correlation Summary
| Measurement | Hawaiian | Immigrants from Portugal |
| Minimum | 28.6% | 13.2% |
| Maximum | 82.3% | 82.5% |
| Range | 53.7% | 69.3% |
| Mean | 62.9% | 53.7% |
| Median | 64.3% | 55.5% |
| Interquartile 25% (IQ1) | 57.2% | 46.2% |
| Interquartile 75% (IQ3) | 69.1% | 62.2% |
| Interquartile Range (IQR) | 11.8% | 16.0% |
| Standard Deviation (Sample) | 10.3% | 14.1% |
| Standard Deviation (Population) | 10.3% | 14.0% |
Similar Demographics by 2 or more Vehicles in Household
Demographics Similar to Hawaiians by 2 or more Vehicles in Household
In terms of 2 or more vehicles in household, the demographic groups most similar to Hawaiians are Guamanian/Chamorro (60.5%, a difference of 0.11%), Finnish (60.3%, a difference of 0.13%), Spanish American Indian (60.3%, a difference of 0.16%), Assyrian/Chaldean/Syriac (60.5%, a difference of 0.23%), and Arapaho (60.2%, a difference of 0.26%).
| Demographics | Rating | Rank | 2 or more Vehicles in Household |
| Swiss | 100.0 /100 | #22 | Exceptional 61.0% |
| Scotch-Irish | 100.0 /100 | #23 | Exceptional 60.9% |
| Immigrants | Vietnam | 100.0 /100 | #24 | Exceptional 60.9% |
| Whites/Caucasians | 100.0 /100 | #25 | Exceptional 60.8% |
| Welsh | 100.0 /100 | #26 | Exceptional 60.8% |
| Assyrians/Chaldeans/Syriacs | 100.0 /100 | #27 | Exceptional 60.5% |
| Guamanians/Chamorros | 100.0 /100 | #28 | Exceptional 60.5% |
| Hawaiians | 100.0 /100 | #29 | Exceptional 60.4% |
| Finns | 100.0 /100 | #30 | Exceptional 60.3% |
| Spanish American Indians | 100.0 /100 | #31 | Exceptional 60.3% |
| Arapaho | 100.0 /100 | #32 | Exceptional 60.2% |
| Immigrants | Mexico | 100.0 /100 | #33 | Exceptional 60.2% |
| Spanish | 100.0 /100 | #34 | Exceptional 60.2% |
| Immigrants | Philippines | 100.0 /100 | #35 | Exceptional 60.1% |
| Chinese | 100.0 /100 | #36 | Exceptional 60.1% |
Demographics Similar to Immigrants from Portugal by 2 or more Vehicles in Household
In terms of 2 or more vehicles in household, the demographic groups most similar to Immigrants from Portugal are Immigrants from Sudan (52.8%, a difference of 0.010%), Immigrants from Brazil (52.8%, a difference of 0.050%), Mongolian (52.8%, a difference of 0.050%), Nigerian (52.8%, a difference of 0.050%), and Colombian (52.9%, a difference of 0.10%).
| Demographics | Rating | Rank | 2 or more Vehicles in Household |
| Immigrants | Ethiopia | 1.5 /100 | #245 | Tragic 53.0% |
| Immigrants | Nigeria | 1.2 /100 | #246 | Tragic 52.9% |
| Sierra Leoneans | 1.2 /100 | #247 | Tragic 52.9% |
| Colombians | 1.1 /100 | #248 | Tragic 52.9% |
| Immigrants | Brazil | 1.0 /100 | #249 | Tragic 52.8% |
| Mongolians | 1.0 /100 | #250 | Tragic 52.8% |
| Immigrants | Sudan | 1.0 /100 | #251 | Tragic 52.8% |
| Immigrants | Portugal | 1.0 /100 | #252 | Tragic 52.8% |
| Nigerians | 0.9 /100 | #253 | Tragic 52.8% |
| Immigrants | Malaysia | 0.8 /100 | #254 | Tragic 52.7% |
| Uruguayans | 0.7 /100 | #255 | Tragic 52.7% |
| Immigrants | Eritrea | 0.7 /100 | #256 | Tragic 52.6% |
| Immigrants | Hong Kong | 0.6 /100 | #257 | Tragic 52.6% |
| Central American Indians | 0.6 /100 | #258 | Tragic 52.5% |
| Alsatians | 0.6 /100 | #259 | Tragic 52.5% |