Haitian vs Northern European No Vehicles in Household
COMPARE
Haitian
Northern European
No Vehicles in Household
No Vehicles in Household Comparison
Haitians
Northern Europeans
14.9%
NO VEHICLES IN HOUSEHOLD
0.0/ 100
METRIC RATING
302nd/ 347
METRIC RANK
7.9%
NO VEHICLES IN HOUSEHOLD
99.9/ 100
METRIC RATING
47th/ 347
METRIC RANK
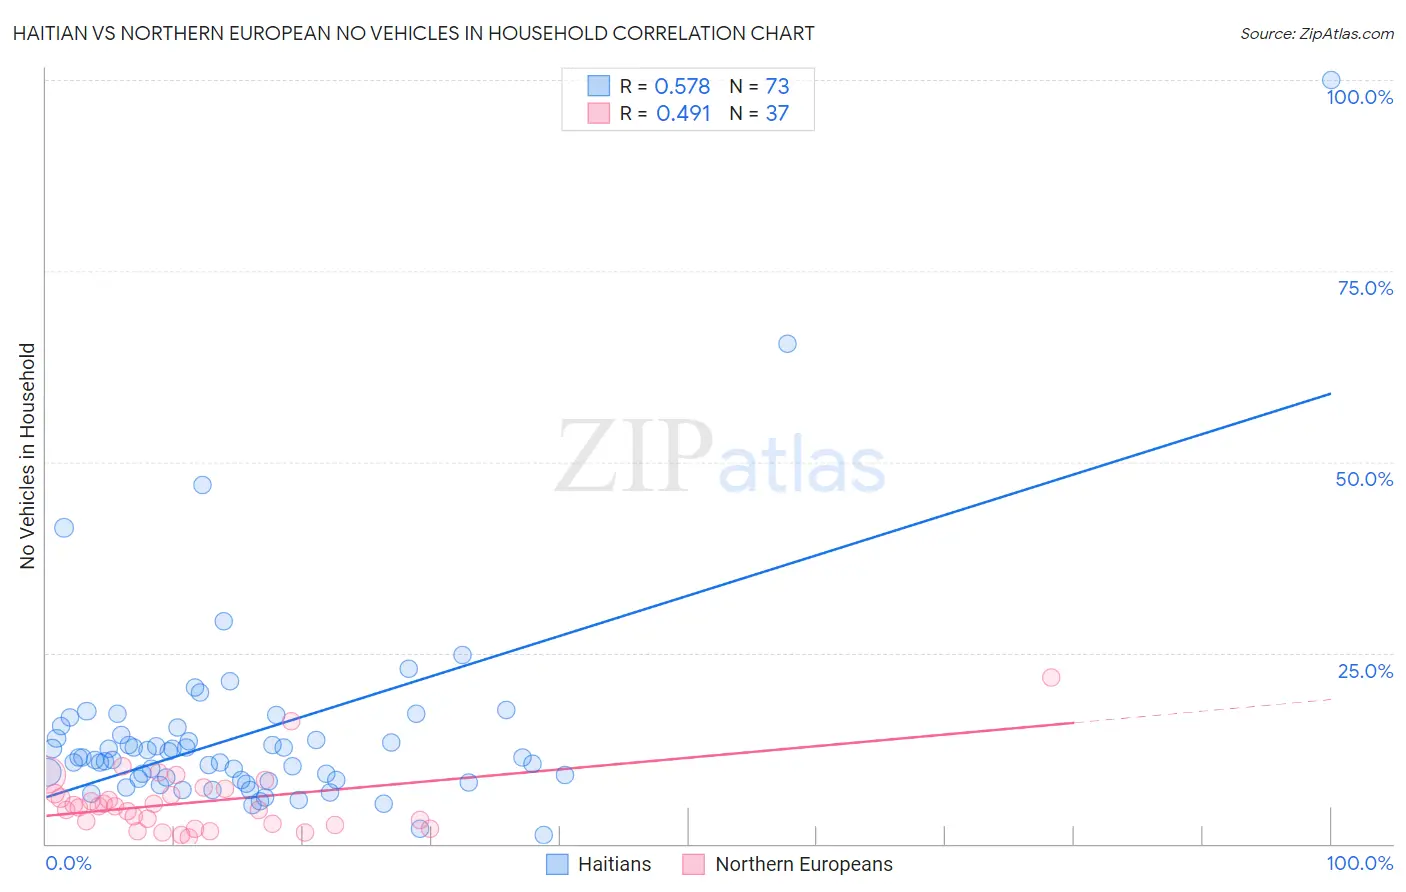
Haitian vs Northern European No Vehicles in Household Correlation Chart
The statistical analysis conducted on geographies consisting of 287,450,258 people shows a substantial positive correlation between the proportion of Haitians and percentage of households with no vehicle available in the United States with a correlation coefficient (R) of 0.578 and weighted average of 14.9%. Similarly, the statistical analysis conducted on geographies consisting of 404,742,877 people shows a moderate positive correlation between the proportion of Northern Europeans and percentage of households with no vehicle available in the United States with a correlation coefficient (R) of 0.491 and weighted average of 7.9%, a difference of 88.2%.
No Vehicles in Household Correlation Summary
| Measurement | Haitian | Northern European |
| Minimum | 1.2% | 0.88% |
| Maximum | 100.0% | 21.8% |
| Range | 98.8% | 20.9% |
| Mean | 14.5% | 5.5% |
| Median | 11.3% | 4.8% |
| Interquartile 25% (IQ1) | 8.4% | 2.6% |
| Interquartile 75% (IQ3) | 14.7% | 6.9% |
| Interquartile Range (IQR) | 6.3% | 4.3% |
| Standard Deviation (Sample) | 13.9% | 4.2% |
| Standard Deviation (Population) | 13.8% | 4.1% |
Similar Demographics by No Vehicles in Household
Demographics Similar to Haitians by No Vehicles in Household
In terms of no vehicles in household, the demographic groups most similar to Haitians are Immigrants from Ukraine (14.9%, a difference of 0.47%), Yuman (14.9%, a difference of 0.48%), Immigrants from Western Africa (15.0%, a difference of 0.52%), Immigrants from Russia (15.1%, a difference of 1.2%), and Immigrants from Greece (14.7%, a difference of 1.5%).
| Demographics | Rating | Rank | No Vehicles in Household |
| Paraguayans | 0.0 /100 | #295 | Tragic 14.4% |
| Immigrants | Spain | 0.0 /100 | #296 | Tragic 14.5% |
| Immigrants | Panama | 0.0 /100 | #297 | Tragic 14.6% |
| Moroccans | 0.0 /100 | #298 | Tragic 14.7% |
| Immigrants | Greece | 0.0 /100 | #299 | Tragic 14.7% |
| Yuman | 0.0 /100 | #300 | Tragic 14.9% |
| Immigrants | Ukraine | 0.0 /100 | #301 | Tragic 14.9% |
| Haitians | 0.0 /100 | #302 | Tragic 14.9% |
| Immigrants | Western Africa | 0.0 /100 | #303 | Tragic 15.0% |
| Immigrants | Russia | 0.0 /100 | #304 | Tragic 15.1% |
| Immigrants | China | 0.0 /100 | #305 | Tragic 15.2% |
| Immigrants | Belize | 0.0 /100 | #306 | Tragic 15.4% |
| Immigrants | Haiti | 0.0 /100 | #307 | Tragic 15.4% |
| U.S. Virgin Islanders | 0.0 /100 | #308 | Tragic 15.4% |
| Puerto Ricans | 0.0 /100 | #309 | Tragic 15.5% |
Demographics Similar to Northern Europeans by No Vehicles in Household
In terms of no vehicles in household, the demographic groups most similar to Northern Europeans are Spanish (7.9%, a difference of 0.12%), Nonimmigrants (7.9%, a difference of 0.38%), Afghan (8.0%, a difference of 0.47%), Choctaw (7.9%, a difference of 0.55%), and Guamanian/Chamorro (8.0%, a difference of 0.65%).
| Demographics | Rating | Rank | No Vehicles in Household |
| Czechoslovakians | 99.9 /100 | #40 | Exceptional 7.8% |
| French Canadians | 99.9 /100 | #41 | Exceptional 7.8% |
| Swiss | 99.9 /100 | #42 | Exceptional 7.9% |
| Chickasaw | 99.9 /100 | #43 | Exceptional 7.9% |
| Choctaw | 99.9 /100 | #44 | Exceptional 7.9% |
| Immigrants | Nonimmigrants | 99.9 /100 | #45 | Exceptional 7.9% |
| Spanish | 99.9 /100 | #46 | Exceptional 7.9% |
| Northern Europeans | 99.9 /100 | #47 | Exceptional 7.9% |
| Afghans | 99.9 /100 | #48 | Exceptional 8.0% |
| Guamanians/Chamorros | 99.9 /100 | #49 | Exceptional 8.0% |
| Belgians | 99.9 /100 | #50 | Exceptional 8.0% |
| Koreans | 99.9 /100 | #51 | Exceptional 8.0% |
| Hawaiians | 99.9 /100 | #52 | Exceptional 8.0% |
| Slovenes | 99.9 /100 | #53 | Exceptional 8.0% |
| Immigrants | Venezuela | 99.9 /100 | #54 | Exceptional 8.1% |