Haitian vs Immigrants from Honduras No Vehicles in Household
COMPARE
Haitian
Immigrants from Honduras
No Vehicles in Household
No Vehicles in Household Comparison
Haitians
Immigrants from Honduras
14.9%
NO VEHICLES IN HOUSEHOLD
0.0/ 100
METRIC RATING
302nd/ 347
METRIC RANK
11.8%
NO VEHICLES IN HOUSEHOLD
2.1/ 100
METRIC RATING
245th/ 347
METRIC RANK
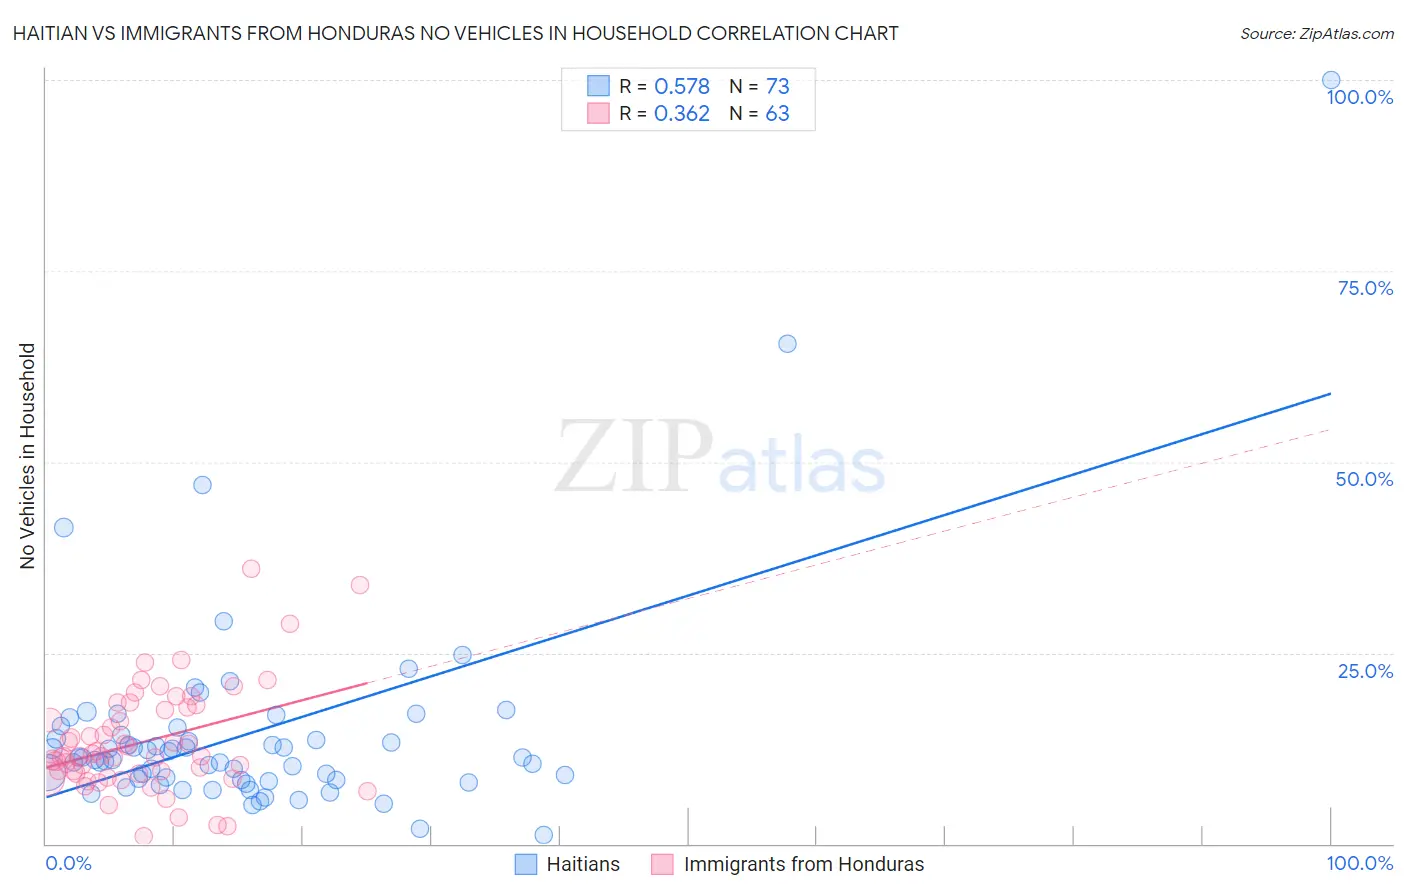
Haitian vs Immigrants from Honduras No Vehicles in Household Correlation Chart
The statistical analysis conducted on geographies consisting of 287,450,258 people shows a substantial positive correlation between the proportion of Haitians and percentage of households with no vehicle available in the United States with a correlation coefficient (R) of 0.578 and weighted average of 14.9%. Similarly, the statistical analysis conducted on geographies consisting of 322,146,811 people shows a mild positive correlation between the proportion of Immigrants from Honduras and percentage of households with no vehicle available in the United States with a correlation coefficient (R) of 0.362 and weighted average of 11.8%, a difference of 26.9%.
No Vehicles in Household Correlation Summary
| Measurement | Haitian | Immigrants from Honduras |
| Minimum | 1.2% | 1.0% |
| Maximum | 100.0% | 35.9% |
| Range | 98.8% | 34.9% |
| Mean | 14.5% | 13.3% |
| Median | 11.3% | 11.5% |
| Interquartile 25% (IQ1) | 8.4% | 9.1% |
| Interquartile 75% (IQ3) | 14.7% | 17.8% |
| Interquartile Range (IQR) | 6.3% | 8.7% |
| Standard Deviation (Sample) | 13.9% | 6.9% |
| Standard Deviation (Population) | 13.8% | 6.8% |
Similar Demographics by No Vehicles in Household
Demographics Similar to Haitians by No Vehicles in Household
In terms of no vehicles in household, the demographic groups most similar to Haitians are Immigrants from Ukraine (14.9%, a difference of 0.47%), Yuman (14.9%, a difference of 0.48%), Immigrants from Western Africa (15.0%, a difference of 0.52%), Immigrants from Russia (15.1%, a difference of 1.2%), and Immigrants from Greece (14.7%, a difference of 1.5%).
| Demographics | Rating | Rank | No Vehicles in Household |
| Paraguayans | 0.0 /100 | #295 | Tragic 14.4% |
| Immigrants | Spain | 0.0 /100 | #296 | Tragic 14.5% |
| Immigrants | Panama | 0.0 /100 | #297 | Tragic 14.6% |
| Moroccans | 0.0 /100 | #298 | Tragic 14.7% |
| Immigrants | Greece | 0.0 /100 | #299 | Tragic 14.7% |
| Yuman | 0.0 /100 | #300 | Tragic 14.9% |
| Immigrants | Ukraine | 0.0 /100 | #301 | Tragic 14.9% |
| Haitians | 0.0 /100 | #302 | Tragic 14.9% |
| Immigrants | Western Africa | 0.0 /100 | #303 | Tragic 15.0% |
| Immigrants | Russia | 0.0 /100 | #304 | Tragic 15.1% |
| Immigrants | China | 0.0 /100 | #305 | Tragic 15.2% |
| Immigrants | Belize | 0.0 /100 | #306 | Tragic 15.4% |
| Immigrants | Haiti | 0.0 /100 | #307 | Tragic 15.4% |
| U.S. Virgin Islanders | 0.0 /100 | #308 | Tragic 15.4% |
| Puerto Ricans | 0.0 /100 | #309 | Tragic 15.5% |
Demographics Similar to Immigrants from Honduras by No Vehicles in Household
In terms of no vehicles in household, the demographic groups most similar to Immigrants from Honduras are Menominee (11.8%, a difference of 0.17%), Immigrants from Portugal (11.7%, a difference of 0.19%), Immigrants from Czechoslovakia (11.8%, a difference of 0.22%), Immigrants from Belgium (11.8%, a difference of 0.23%), and Immigrants from Nigeria (11.8%, a difference of 0.26%).
| Demographics | Rating | Rank | No Vehicles in Household |
| Russians | 3.2 /100 | #238 | Tragic 11.6% |
| Taiwanese | 2.8 /100 | #239 | Tragic 11.7% |
| Immigrants | Immigrants | 2.7 /100 | #240 | Tragic 11.7% |
| Eastern Europeans | 2.7 /100 | #241 | Tragic 11.7% |
| Turks | 2.6 /100 | #242 | Tragic 11.7% |
| Cheyenne | 2.4 /100 | #243 | Tragic 11.7% |
| Immigrants | Portugal | 2.2 /100 | #244 | Tragic 11.7% |
| Immigrants | Honduras | 2.1 /100 | #245 | Tragic 11.8% |
| Menominee | 2.0 /100 | #246 | Tragic 11.8% |
| Immigrants | Czechoslovakia | 2.0 /100 | #247 | Tragic 11.8% |
| Immigrants | Belgium | 1.9 /100 | #248 | Tragic 11.8% |
| Immigrants | Nigeria | 1.9 /100 | #249 | Tragic 11.8% |
| Paiute | 1.8 /100 | #250 | Tragic 11.8% |
| Blacks/African Americans | 1.6 /100 | #251 | Tragic 11.9% |
| Immigrants | Serbia | 1.5 /100 | #252 | Tragic 11.9% |