African vs Northern European No Vehicles in Household
COMPARE
African
Northern European
No Vehicles in Household
No Vehicles in Household Comparison
Africans
Northern Europeans
12.3%
NO VEHICLES IN HOUSEHOLD
0.4/ 100
METRIC RATING
265th/ 347
METRIC RANK
7.9%
NO VEHICLES IN HOUSEHOLD
99.9/ 100
METRIC RATING
47th/ 347
METRIC RANK
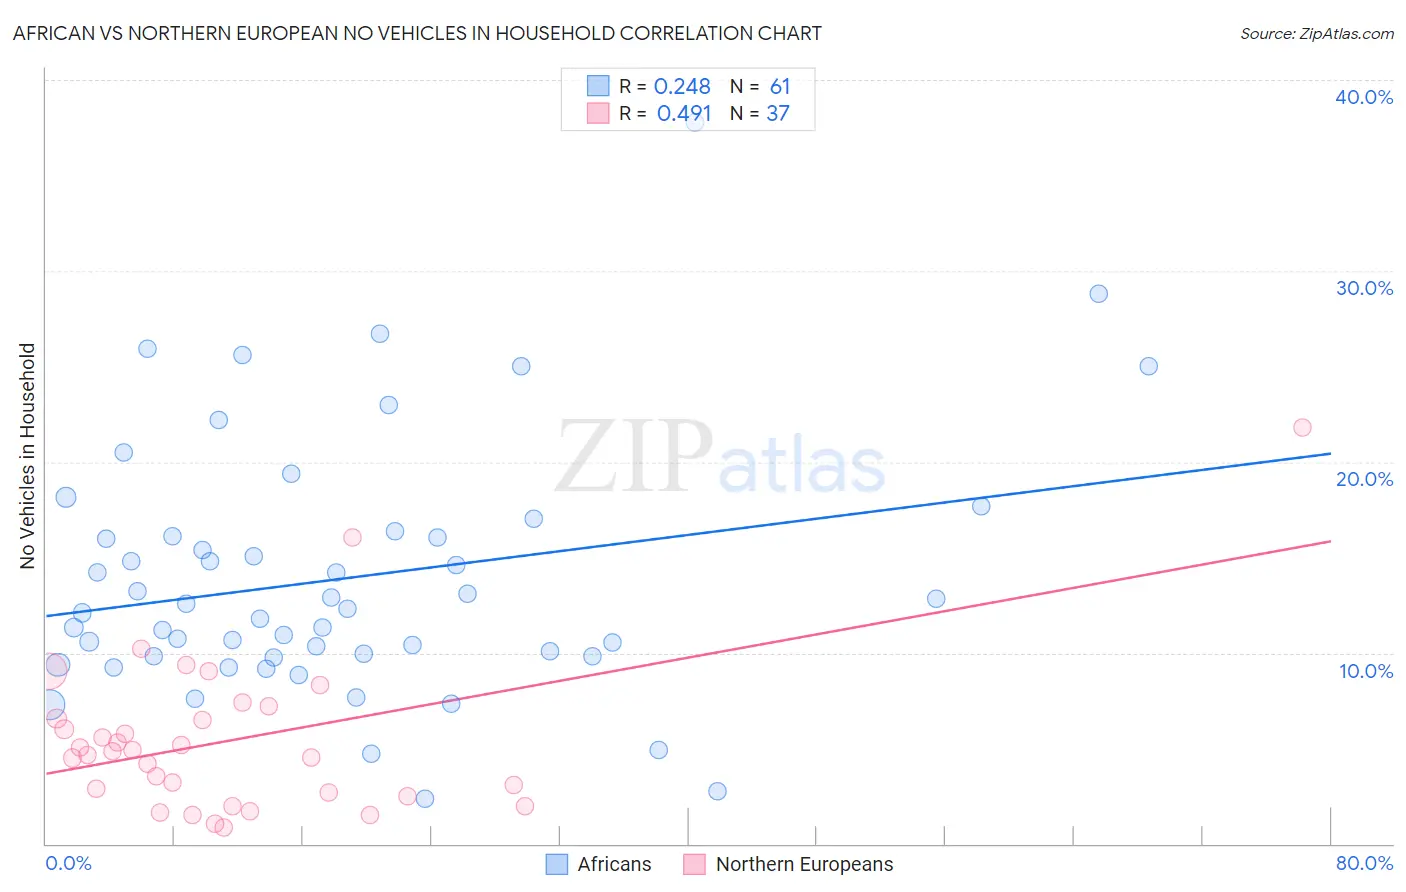
African vs Northern European No Vehicles in Household Correlation Chart
The statistical analysis conducted on geographies consisting of 468,587,703 people shows a weak positive correlation between the proportion of Africans and percentage of households with no vehicle available in the United States with a correlation coefficient (R) of 0.248 and weighted average of 12.3%. Similarly, the statistical analysis conducted on geographies consisting of 404,742,877 people shows a moderate positive correlation between the proportion of Northern Europeans and percentage of households with no vehicle available in the United States with a correlation coefficient (R) of 0.491 and weighted average of 7.9%, a difference of 55.4%.
No Vehicles in Household Correlation Summary
| Measurement | African | Northern European |
| Minimum | 2.4% | 0.88% |
| Maximum | 37.8% | 21.8% |
| Range | 35.4% | 20.9% |
| Mean | 13.9% | 5.5% |
| Median | 12.3% | 4.8% |
| Interquartile 25% (IQ1) | 9.8% | 2.6% |
| Interquartile 75% (IQ3) | 16.3% | 6.9% |
| Interquartile Range (IQR) | 6.4% | 4.3% |
| Standard Deviation (Sample) | 6.7% | 4.2% |
| Standard Deviation (Population) | 6.6% | 4.1% |
Similar Demographics by No Vehicles in Household
Demographics Similar to Africans by No Vehicles in Household
In terms of no vehicles in household, the demographic groups most similar to Africans are Immigrants from Switzerland (12.3%, a difference of 0.25%), Immigrants from Egypt (12.2%, a difference of 0.71%), Immigrants from Liberia (12.2%, a difference of 0.86%), Subsaharan African (12.2%, a difference of 0.93%), and Israeli (12.4%, a difference of 0.96%).
| Demographics | Rating | Rank | No Vehicles in Household |
| South American Indians | 0.9 /100 | #258 | Tragic 12.1% |
| Immigrants | Latvia | 0.8 /100 | #259 | Tragic 12.1% |
| Macedonians | 0.7 /100 | #260 | Tragic 12.2% |
| Sub-Saharan Africans | 0.6 /100 | #261 | Tragic 12.2% |
| Immigrants | Liberia | 0.6 /100 | #262 | Tragic 12.2% |
| Immigrants | Egypt | 0.6 /100 | #263 | Tragic 12.2% |
| Immigrants | Switzerland | 0.5 /100 | #264 | Tragic 12.3% |
| Africans | 0.4 /100 | #265 | Tragic 12.3% |
| Israelis | 0.3 /100 | #266 | Tragic 12.4% |
| Immigrants | Europe | 0.3 /100 | #267 | Tragic 12.5% |
| Immigrants | Africa | 0.2 /100 | #268 | Tragic 12.5% |
| Panamanians | 0.2 /100 | #269 | Tragic 12.5% |
| Immigrants | Northern Africa | 0.2 /100 | #270 | Tragic 12.6% |
| Immigrants | Morocco | 0.2 /100 | #271 | Tragic 12.6% |
| Bermudans | 0.1 /100 | #272 | Tragic 12.8% |
Demographics Similar to Northern Europeans by No Vehicles in Household
In terms of no vehicles in household, the demographic groups most similar to Northern Europeans are Spanish (7.9%, a difference of 0.12%), Nonimmigrants (7.9%, a difference of 0.38%), Afghan (8.0%, a difference of 0.47%), Choctaw (7.9%, a difference of 0.55%), and Guamanian/Chamorro (8.0%, a difference of 0.65%).
| Demographics | Rating | Rank | No Vehicles in Household |
| Czechoslovakians | 99.9 /100 | #40 | Exceptional 7.8% |
| French Canadians | 99.9 /100 | #41 | Exceptional 7.8% |
| Swiss | 99.9 /100 | #42 | Exceptional 7.9% |
| Chickasaw | 99.9 /100 | #43 | Exceptional 7.9% |
| Choctaw | 99.9 /100 | #44 | Exceptional 7.9% |
| Immigrants | Nonimmigrants | 99.9 /100 | #45 | Exceptional 7.9% |
| Spanish | 99.9 /100 | #46 | Exceptional 7.9% |
| Northern Europeans | 99.9 /100 | #47 | Exceptional 7.9% |
| Afghans | 99.9 /100 | #48 | Exceptional 8.0% |
| Guamanians/Chamorros | 99.9 /100 | #49 | Exceptional 8.0% |
| Belgians | 99.9 /100 | #50 | Exceptional 8.0% |
| Koreans | 99.9 /100 | #51 | Exceptional 8.0% |
| Hawaiians | 99.9 /100 | #52 | Exceptional 8.0% |
| Slovenes | 99.9 /100 | #53 | Exceptional 8.0% |
| Immigrants | Venezuela | 99.9 /100 | #54 | Exceptional 8.1% |