Haitian vs Northern European Unemployment Among Ages 20 to 24 years
COMPARE
Haitian
Northern European
Unemployment Among Ages 20 to 24 years
Unemployment Among Ages 20 to 24 years Comparison
Haitians
Northern Europeans
12.2%
UNEMPLOYMENT AMONG AGES 20 TO 24 YEARS
0.0/ 100
METRIC RATING
303rd/ 347
METRIC RANK
10.1%
UNEMPLOYMENT AMONG AGES 20 TO 24 YEARS
92.7/ 100
METRIC RATING
112th/ 347
METRIC RANK
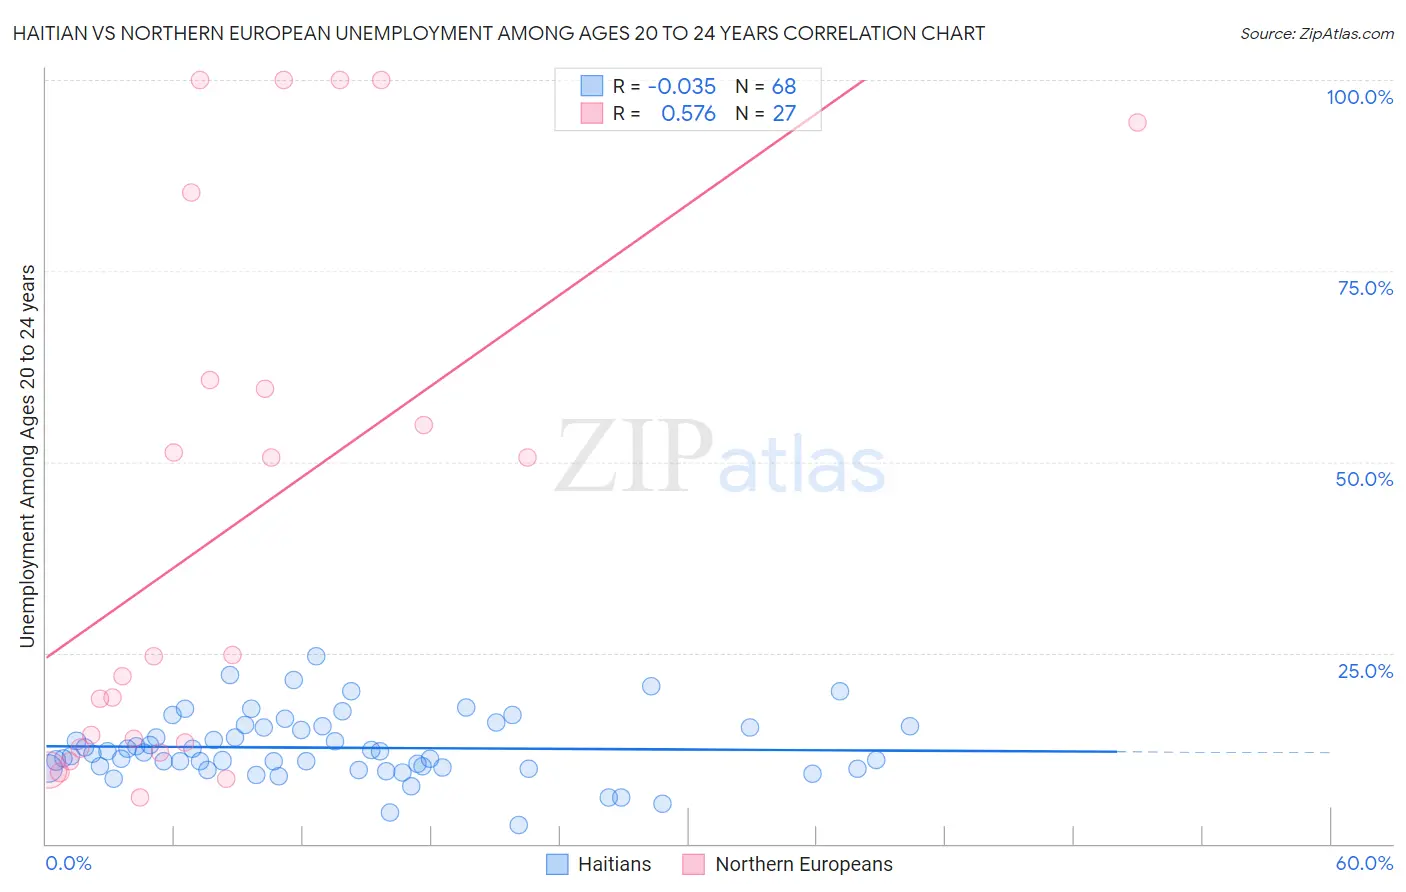
Haitian vs Northern European Unemployment Among Ages 20 to 24 years Correlation Chart
The statistical analysis conducted on geographies consisting of 282,021,864 people shows no correlation between the proportion of Haitians and unemployment rate among population between the ages 20 and 24 in the United States with a correlation coefficient (R) of -0.035 and weighted average of 12.2%. Similarly, the statistical analysis conducted on geographies consisting of 389,153,770 people shows a substantial positive correlation between the proportion of Northern Europeans and unemployment rate among population between the ages 20 and 24 in the United States with a correlation coefficient (R) of 0.576 and weighted average of 10.1%, a difference of 21.4%.
Unemployment Among Ages 20 to 24 years Correlation Summary
| Measurement | Haitian | Northern European |
| Minimum | 2.4% | 6.0% |
| Maximum | 24.6% | 100.0% |
| Range | 22.2% | 94.0% |
| Mean | 12.6% | 41.7% |
| Median | 11.8% | 24.6% |
| Interquartile 25% (IQ1) | 9.9% | 12.5% |
| Interquartile 75% (IQ3) | 15.3% | 60.7% |
| Interquartile Range (IQR) | 5.3% | 48.2% |
| Standard Deviation (Sample) | 4.2% | 34.4% |
| Standard Deviation (Population) | 4.2% | 33.8% |
Similar Demographics by Unemployment Among Ages 20 to 24 years
Demographics Similar to Haitians by Unemployment Among Ages 20 to 24 years
In terms of unemployment among ages 20 to 24 years, the demographic groups most similar to Haitians are Immigrants from Cabo Verde (12.2%, a difference of 0.020%), Immigrants from West Indies (12.3%, a difference of 0.59%), Chippewa (12.3%, a difference of 0.64%), Immigrants from Sierra Leone (12.1%, a difference of 0.87%), and Spanish American Indian (12.1%, a difference of 1.4%).
| Demographics | Rating | Rank | Unemployment Among Ages 20 to 24 years |
| Cajuns | 0.0 /100 | #296 | Tragic 12.0% |
| Blackfeet | 0.0 /100 | #297 | Tragic 12.0% |
| Lumbee | 0.0 /100 | #298 | Tragic 12.0% |
| Apache | 0.0 /100 | #299 | Tragic 12.0% |
| Spanish American Indians | 0.0 /100 | #300 | Tragic 12.1% |
| Immigrants | Sierra Leone | 0.0 /100 | #301 | Tragic 12.1% |
| Immigrants | Cabo Verde | 0.0 /100 | #302 | Tragic 12.2% |
| Haitians | 0.0 /100 | #303 | Tragic 12.2% |
| Immigrants | West Indies | 0.0 /100 | #304 | Tragic 12.3% |
| Chippewa | 0.0 /100 | #305 | Tragic 12.3% |
| Immigrants | Haiti | 0.0 /100 | #306 | Tragic 12.4% |
| Bermudans | 0.0 /100 | #307 | Tragic 12.5% |
| Tohono O'odham | 0.0 /100 | #308 | Tragic 12.5% |
| Immigrants | Bangladesh | 0.0 /100 | #309 | Tragic 12.6% |
| Jamaicans | 0.0 /100 | #310 | Tragic 12.6% |
Demographics Similar to Northern Europeans by Unemployment Among Ages 20 to 24 years
In terms of unemployment among ages 20 to 24 years, the demographic groups most similar to Northern Europeans are Immigrants from Indonesia (10.1%, a difference of 0.010%), German Russian (10.1%, a difference of 0.030%), Immigrants from Spain (10.1%, a difference of 0.070%), Immigrants from Latvia (10.1%, a difference of 0.080%), and Filipino (10.1%, a difference of 0.080%).
| Demographics | Rating | Rank | Unemployment Among Ages 20 to 24 years |
| Immigrants | Hungary | 94.0 /100 | #105 | Exceptional 10.0% |
| Pennsylvania Germans | 93.9 /100 | #106 | Exceptional 10.0% |
| Iroquois | 93.4 /100 | #107 | Exceptional 10.1% |
| Immigrants | Latvia | 93.2 /100 | #108 | Exceptional 10.1% |
| Filipinos | 93.2 /100 | #109 | Exceptional 10.1% |
| Immigrants | Spain | 93.1 /100 | #110 | Exceptional 10.1% |
| Immigrants | Indonesia | 92.7 /100 | #111 | Exceptional 10.1% |
| Northern Europeans | 92.7 /100 | #112 | Exceptional 10.1% |
| German Russians | 92.4 /100 | #113 | Exceptional 10.1% |
| Ottawa | 90.8 /100 | #114 | Exceptional 10.1% |
| Immigrants | Morocco | 90.5 /100 | #115 | Exceptional 10.1% |
| Basques | 89.8 /100 | #116 | Excellent 10.1% |
| Immigrants | Uruguay | 89.6 /100 | #117 | Excellent 10.1% |
| Paraguayans | 88.6 /100 | #118 | Excellent 10.1% |
| French | 88.2 /100 | #119 | Excellent 10.1% |