Ghanaian vs Mexican 4 or more Vehicles in Household
COMPARE
Ghanaian
Mexican
4 or more Vehicles in Household
4 or more Vehicles in Household Comparison
Ghanaians
Mexicans
5.2%
4 OR MORE VEHICLES IN HOUSEHOLD
0.1/ 100
METRIC RATING
294th/ 347
METRIC RANK
8.9%
4 OR MORE VEHICLES IN HOUSEHOLD
100.0/ 100
METRIC RATING
12th/ 347
METRIC RANK
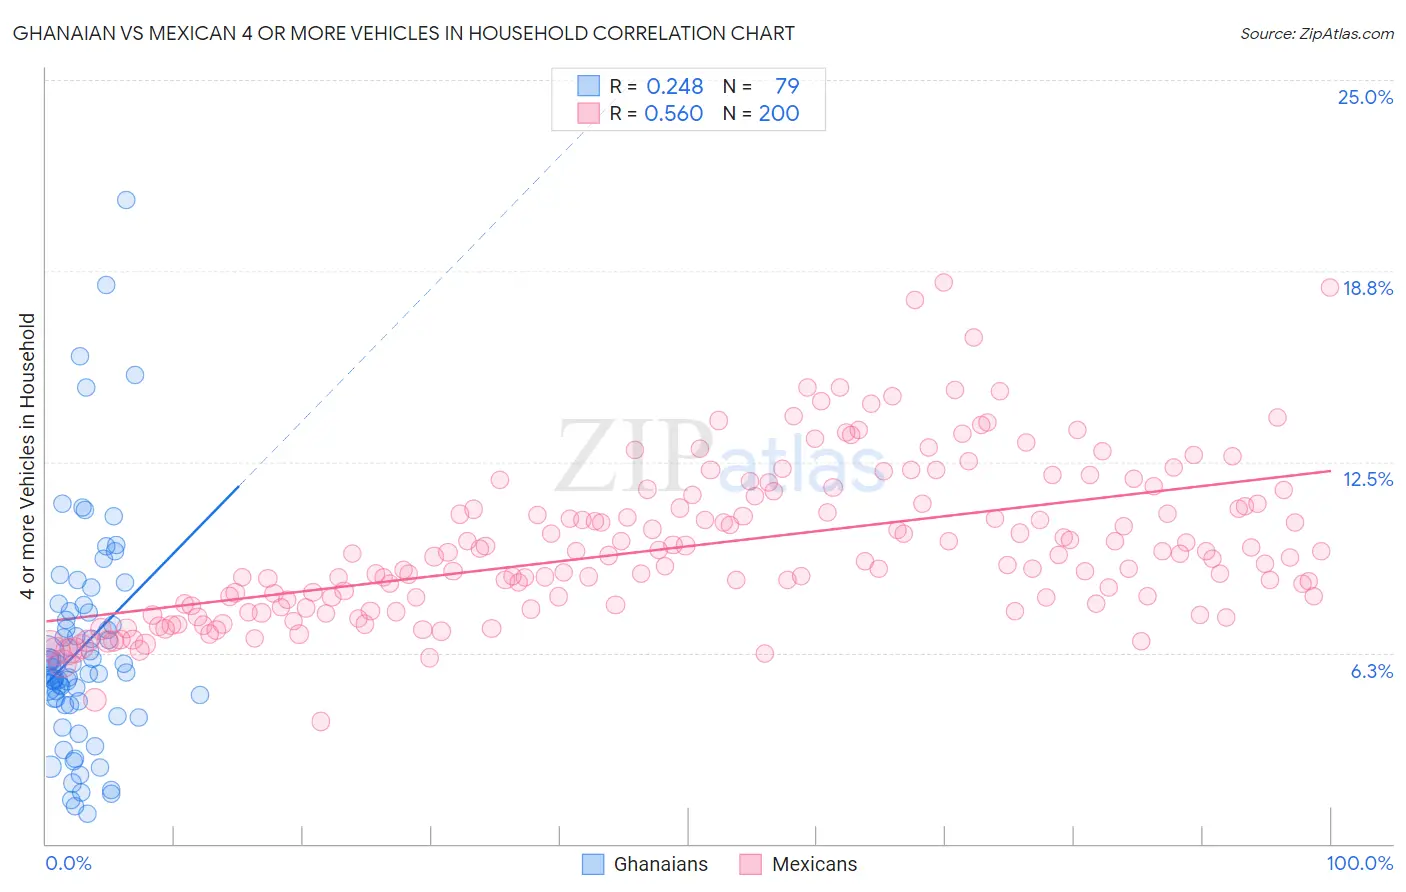
Ghanaian vs Mexican 4 or more Vehicles in Household Correlation Chart
The statistical analysis conducted on geographies consisting of 189,616,639 people shows a weak positive correlation between the proportion of Ghanaians and percentage of households with 4 or more vehicles available in the United States with a correlation coefficient (R) of 0.248 and weighted average of 5.2%. Similarly, the statistical analysis conducted on geographies consisting of 561,781,300 people shows a substantial positive correlation between the proportion of Mexicans and percentage of households with 4 or more vehicles available in the United States with a correlation coefficient (R) of 0.560 and weighted average of 8.9%, a difference of 70.4%.
4 or more Vehicles in Household Correlation Summary
| Measurement | Ghanaian | Mexican |
| Minimum | 0.97% | 4.0% |
| Maximum | 21.1% | 18.4% |
| Range | 20.1% | 14.3% |
| Mean | 6.4% | 9.7% |
| Median | 5.8% | 9.4% |
| Interquartile 25% (IQ1) | 4.6% | 7.8% |
| Interquartile 75% (IQ3) | 7.6% | 11.1% |
| Interquartile Range (IQR) | 3.1% | 3.3% |
| Standard Deviation (Sample) | 3.7% | 2.5% |
| Standard Deviation (Population) | 3.7% | 2.5% |
Similar Demographics by 4 or more Vehicles in Household
Demographics Similar to Ghanaians by 4 or more Vehicles in Household
In terms of 4 or more vehicles in household, the demographic groups most similar to Ghanaians are Immigrants from Congo (5.2%, a difference of 0.050%), Liberian (5.3%, a difference of 0.090%), Immigrants from Brazil (5.2%, a difference of 0.11%), Immigrants from Bahamas (5.3%, a difference of 0.19%), and Israeli (5.2%, a difference of 0.29%).
| Demographics | Rating | Rank | 4 or more Vehicles in Household |
| Immigrants | Croatia | 0.2 /100 | #287 | Tragic 5.4% |
| Venezuelans | 0.2 /100 | #288 | Tragic 5.3% |
| Immigrants | Bosnia and Herzegovina | 0.2 /100 | #289 | Tragic 5.3% |
| Immigrants | Russia | 0.2 /100 | #290 | Tragic 5.3% |
| Immigrants | Bahamas | 0.1 /100 | #291 | Tragic 5.3% |
| Liberians | 0.1 /100 | #292 | Tragic 5.3% |
| Immigrants | Congo | 0.1 /100 | #293 | Tragic 5.2% |
| Ghanaians | 0.1 /100 | #294 | Tragic 5.2% |
| Immigrants | Brazil | 0.1 /100 | #295 | Tragic 5.2% |
| Israelis | 0.1 /100 | #296 | Tragic 5.2% |
| Immigrants | Venezuela | 0.1 /100 | #297 | Tragic 5.2% |
| Immigrants | South America | 0.1 /100 | #298 | Tragic 5.2% |
| Immigrants | Ghana | 0.1 /100 | #299 | Tragic 5.2% |
| Immigrants | Morocco | 0.0 /100 | #300 | Tragic 5.1% |
| Immigrants | Zaire | 0.0 /100 | #301 | Tragic 5.1% |
Demographics Similar to Mexicans by 4 or more Vehicles in Household
In terms of 4 or more vehicles in household, the demographic groups most similar to Mexicans are Hawaiian (8.9%, a difference of 0.010%), Immigrants from Mexico (9.0%, a difference of 0.68%), Paiute (9.0%, a difference of 0.80%), Chinese (8.8%, a difference of 1.0%), and Shoshone (8.8%, a difference of 1.0%).
| Demographics | Rating | Rank | 4 or more Vehicles in Household |
| Immigrants | Fiji | 100.0 /100 | #5 | Exceptional 9.6% |
| Puget Sound Salish | 100.0 /100 | #6 | Exceptional 9.4% |
| Native Hawaiians | 100.0 /100 | #7 | Exceptional 9.4% |
| Arapaho | 100.0 /100 | #8 | Exceptional 9.4% |
| Samoans | 100.0 /100 | #9 | Exceptional 9.2% |
| Paiute | 100.0 /100 | #10 | Exceptional 9.0% |
| Immigrants | Mexico | 100.0 /100 | #11 | Exceptional 9.0% |
| Mexicans | 100.0 /100 | #12 | Exceptional 8.9% |
| Hawaiians | 100.0 /100 | #13 | Exceptional 8.9% |
| Chinese | 100.0 /100 | #14 | Exceptional 8.8% |
| Shoshone | 100.0 /100 | #15 | Exceptional 8.8% |
| Lumbee | 100.0 /100 | #16 | Exceptional 8.8% |
| Ute | 100.0 /100 | #17 | Exceptional 8.8% |
| Nepalese | 100.0 /100 | #18 | Exceptional 8.7% |
| Koreans | 100.0 /100 | #19 | Exceptional 8.6% |