Immigrants from Cameroon vs Immigrants from Belarus 4 or more Vehicles in Household
COMPARE
Immigrants from Cameroon
Immigrants from Belarus
4 or more Vehicles in Household
4 or more Vehicles in Household Comparison
Immigrants from Cameroon
Immigrants from Belarus
6.4%
4 OR MORE VEHICLES IN HOUSEHOLD
64.4/ 100
METRIC RATING
161st/ 347
METRIC RANK
4.7%
4 OR MORE VEHICLES IN HOUSEHOLD
0.0/ 100
METRIC RATING
315th/ 347
METRIC RANK
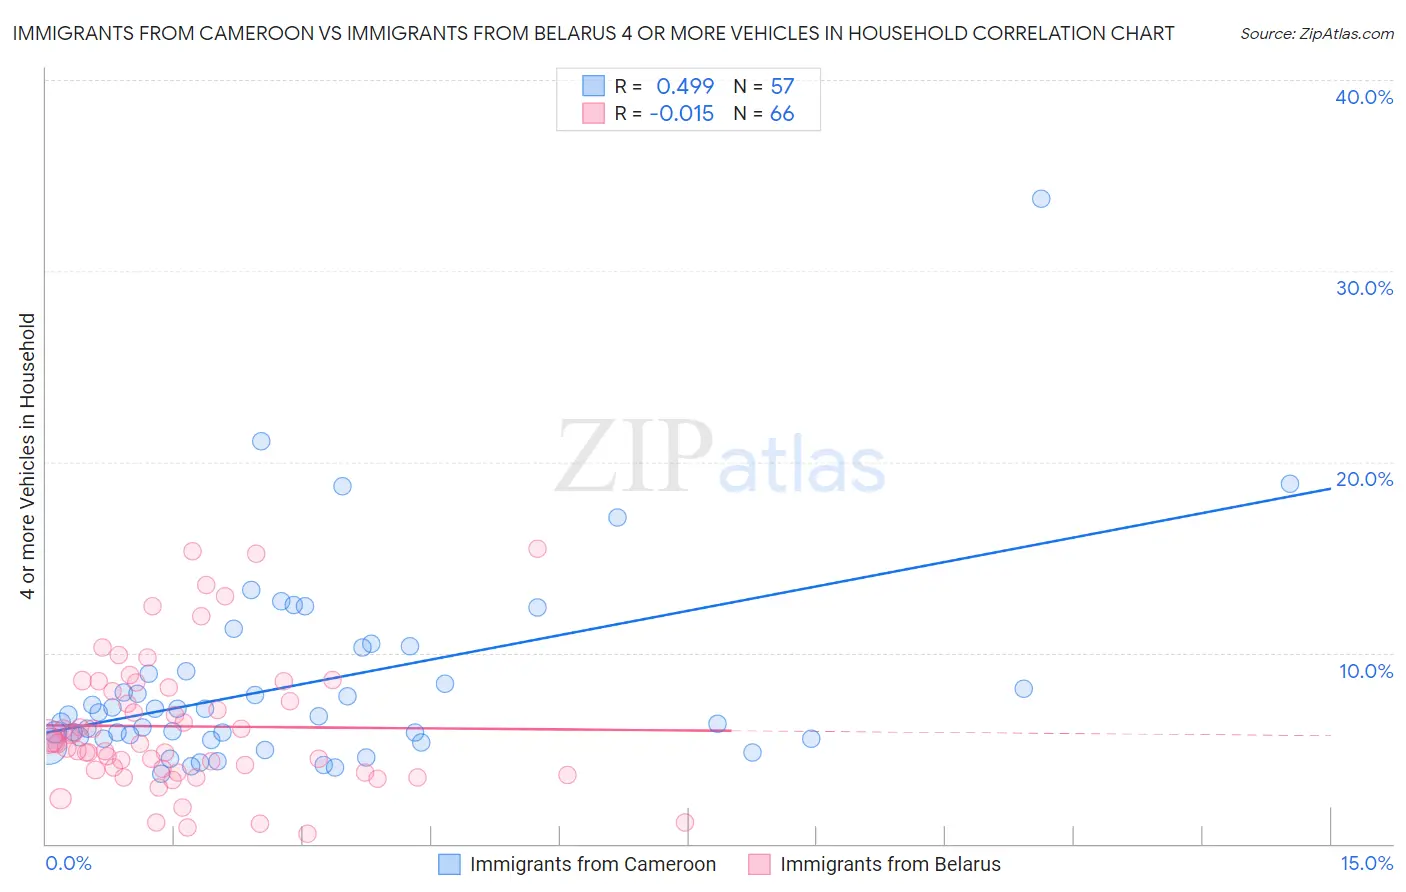
Immigrants from Cameroon vs Immigrants from Belarus 4 or more Vehicles in Household Correlation Chart
The statistical analysis conducted on geographies consisting of 130,454,294 people shows a moderate positive correlation between the proportion of Immigrants from Cameroon and percentage of households with 4 or more vehicles available in the United States with a correlation coefficient (R) of 0.499 and weighted average of 6.4%. Similarly, the statistical analysis conducted on geographies consisting of 149,564,029 people shows no correlation between the proportion of Immigrants from Belarus and percentage of households with 4 or more vehicles available in the United States with a correlation coefficient (R) of -0.015 and weighted average of 4.7%, a difference of 35.4%.
4 or more Vehicles in Household Correlation Summary
| Measurement | Immigrants from Cameroon | Immigrants from Belarus |
| Minimum | 3.7% | 0.52% |
| Maximum | 33.8% | 15.4% |
| Range | 30.1% | 14.9% |
| Mean | 8.4% | 6.1% |
| Median | 6.7% | 5.3% |
| Interquartile 25% (IQ1) | 5.5% | 3.9% |
| Interquartile 75% (IQ3) | 9.6% | 8.2% |
| Interquartile Range (IQR) | 4.1% | 4.3% |
| Standard Deviation (Sample) | 5.2% | 3.5% |
| Standard Deviation (Population) | 5.2% | 3.5% |
Similar Demographics by 4 or more Vehicles in Household
Demographics Similar to Immigrants from Cameroon by 4 or more Vehicles in Household
In terms of 4 or more vehicles in household, the demographic groups most similar to Immigrants from Cameroon are Immigrants from Pakistan (6.4%, a difference of 0.13%), Palestinian (6.4%, a difference of 0.15%), Indian (Asian) (6.4%, a difference of 0.21%), Zimbabwean (6.4%, a difference of 0.30%), and Chilean (6.4%, a difference of 0.34%).
| Demographics | Rating | Rank | 4 or more Vehicles in Household |
| Central American Indians | 71.1 /100 | #154 | Good 6.5% |
| Iroquois | 70.4 /100 | #155 | Good 6.5% |
| Iranians | 69.9 /100 | #156 | Good 6.5% |
| Peruvians | 69.4 /100 | #157 | Good 6.5% |
| Zimbabweans | 67.1 /100 | #158 | Good 6.4% |
| Indians (Asian) | 66.3 /100 | #159 | Good 6.4% |
| Palestinians | 65.8 /100 | #160 | Good 6.4% |
| Immigrants | Cameroon | 64.4 /100 | #161 | Good 6.4% |
| Immigrants | Pakistan | 63.2 /100 | #162 | Good 6.4% |
| Chileans | 61.2 /100 | #163 | Good 6.4% |
| Hungarians | 61.1 /100 | #164 | Good 6.4% |
| Immigrants | Peru | 59.8 /100 | #165 | Average 6.4% |
| Immigrants | Denmark | 57.8 /100 | #166 | Average 6.4% |
| Poles | 56.9 /100 | #167 | Average 6.4% |
| Lebanese | 55.8 /100 | #168 | Average 6.4% |
Demographics Similar to Immigrants from Belarus by 4 or more Vehicles in Household
In terms of 4 or more vehicles in household, the demographic groups most similar to Immigrants from Belarus are Immigrants from West Indies (4.7%, a difference of 0.090%), Puerto Rican (4.7%, a difference of 0.44%), Immigrants from Israel (4.8%, a difference of 0.88%), Albanian (4.8%, a difference of 0.90%), and U.S. Virgin Islander (4.6%, a difference of 2.1%).
| Demographics | Rating | Rank | 4 or more Vehicles in Household |
| Paraguayans | 0.0 /100 | #308 | Tragic 4.9% |
| Immigrants | Somalia | 0.0 /100 | #309 | Tragic 4.9% |
| Moroccans | 0.0 /100 | #310 | Tragic 4.9% |
| Houma | 0.0 /100 | #311 | Tragic 4.9% |
| Albanians | 0.0 /100 | #312 | Tragic 4.8% |
| Immigrants | Israel | 0.0 /100 | #313 | Tragic 4.8% |
| Immigrants | West Indies | 0.0 /100 | #314 | Tragic 4.7% |
| Immigrants | Belarus | 0.0 /100 | #315 | Tragic 4.7% |
| Puerto Ricans | 0.0 /100 | #316 | Tragic 4.7% |
| U.S. Virgin Islanders | 0.0 /100 | #317 | Tragic 4.6% |
| Jamaicans | 0.0 /100 | #318 | Tragic 4.6% |
| Haitians | 0.0 /100 | #319 | Tragic 4.6% |
| Immigrants | Haiti | 0.0 /100 | #320 | Tragic 4.5% |
| Ecuadorians | 0.0 /100 | #321 | Tragic 4.5% |
| Immigrants | Yemen | 0.0 /100 | #322 | Tragic 4.5% |