French vs Immigrants from Belarus 4 or more Vehicles in Household
COMPARE
French
Immigrants from Belarus
4 or more Vehicles in Household
4 or more Vehicles in Household Comparison
French
Immigrants from Belarus
6.9%
4 OR MORE VEHICLES IN HOUSEHOLD
97.7/ 100
METRIC RATING
108th/ 347
METRIC RANK
4.7%
4 OR MORE VEHICLES IN HOUSEHOLD
0.0/ 100
METRIC RATING
315th/ 347
METRIC RANK
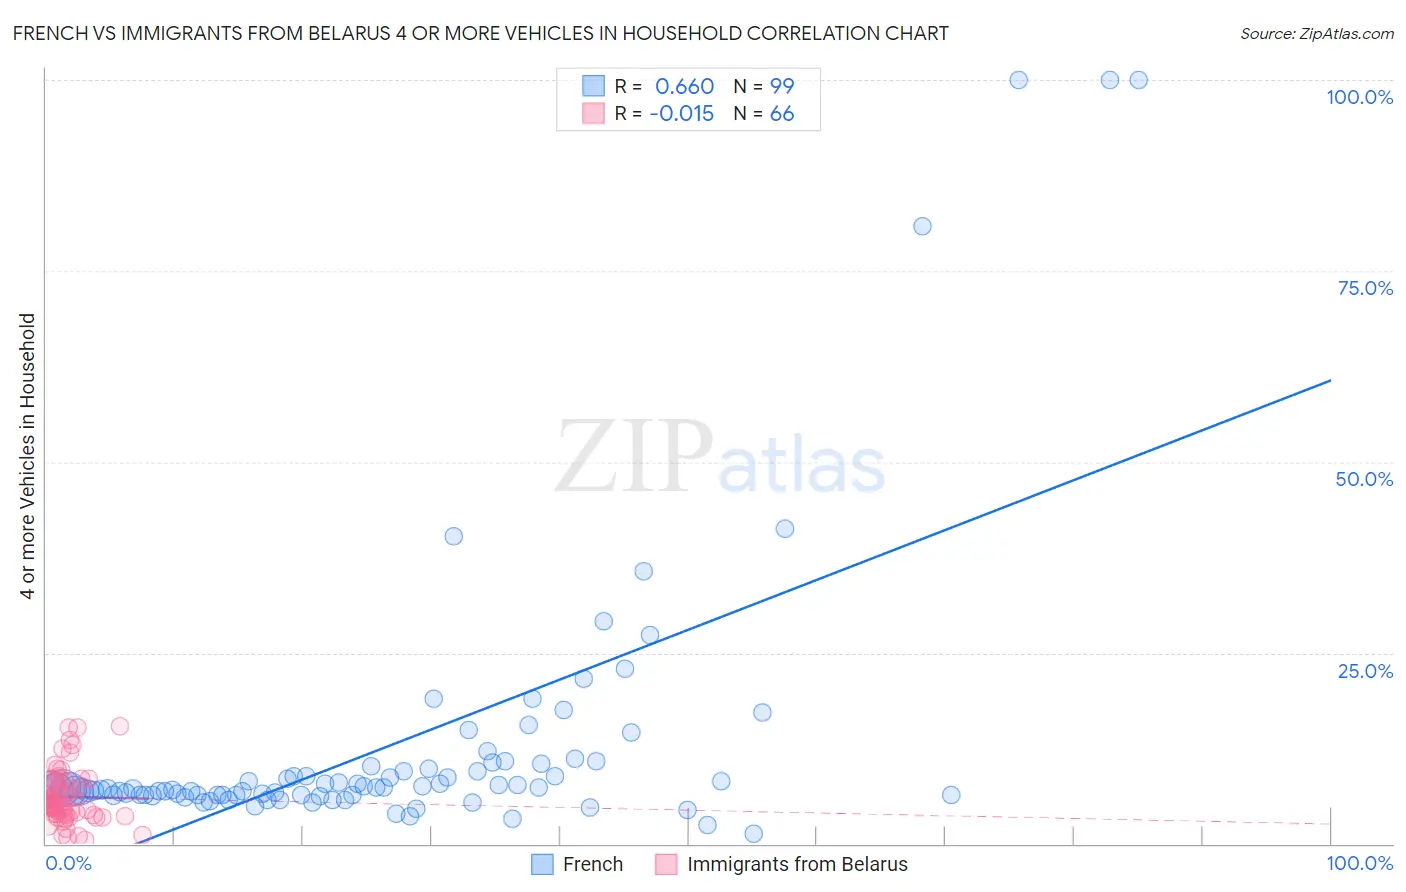
French vs Immigrants from Belarus 4 or more Vehicles in Household Correlation Chart
The statistical analysis conducted on geographies consisting of 568,874,397 people shows a significant positive correlation between the proportion of French and percentage of households with 4 or more vehicles available in the United States with a correlation coefficient (R) of 0.660 and weighted average of 6.9%. Similarly, the statistical analysis conducted on geographies consisting of 149,564,029 people shows no correlation between the proportion of Immigrants from Belarus and percentage of households with 4 or more vehicles available in the United States with a correlation coefficient (R) of -0.015 and weighted average of 4.7%, a difference of 46.1%.
4 or more Vehicles in Household Correlation Summary
| Measurement | French | Immigrants from Belarus |
| Minimum | 1.3% | 0.52% |
| Maximum | 100.0% | 15.4% |
| Range | 98.7% | 14.9% |
| Mean | 13.0% | 6.1% |
| Median | 7.2% | 5.3% |
| Interquartile 25% (IQ1) | 6.4% | 3.9% |
| Interquartile 75% (IQ3) | 10.2% | 8.2% |
| Interquartile Range (IQR) | 3.8% | 4.3% |
| Standard Deviation (Sample) | 18.4% | 3.5% |
| Standard Deviation (Population) | 18.3% | 3.5% |
Similar Demographics by 4 or more Vehicles in Household
Demographics Similar to French by 4 or more Vehicles in Household
In terms of 4 or more vehicles in household, the demographic groups most similar to French are Filipino (6.9%, a difference of 0.18%), Nicaraguan (7.0%, a difference of 0.34%), Guatemalan (7.0%, a difference of 0.35%), German Russian (7.0%, a difference of 0.69%), and Immigrants from Thailand (6.9%, a difference of 0.69%).
| Demographics | Rating | Rank | 4 or more Vehicles in Household |
| Pakistanis | 98.7 /100 | #101 | Exceptional 7.0% |
| Asians | 98.6 /100 | #102 | Exceptional 7.0% |
| Blackfeet | 98.6 /100 | #103 | Exceptional 7.0% |
| Hmong | 98.3 /100 | #104 | Exceptional 7.0% |
| German Russians | 98.3 /100 | #105 | Exceptional 7.0% |
| Guatemalans | 98.1 /100 | #106 | Exceptional 7.0% |
| Nicaraguans | 98.0 /100 | #107 | Exceptional 7.0% |
| French | 97.7 /100 | #108 | Exceptional 6.9% |
| Filipinos | 97.6 /100 | #109 | Exceptional 6.9% |
| Immigrants | Thailand | 97.0 /100 | #110 | Exceptional 6.9% |
| Aleuts | 97.0 /100 | #111 | Exceptional 6.9% |
| Hopi | 97.0 /100 | #112 | Exceptional 6.9% |
| Canadians | 96.4 /100 | #113 | Exceptional 6.9% |
| Bolivians | 96.3 /100 | #114 | Exceptional 6.8% |
| Tlingit-Haida | 96.2 /100 | #115 | Exceptional 6.8% |
Demographics Similar to Immigrants from Belarus by 4 or more Vehicles in Household
In terms of 4 or more vehicles in household, the demographic groups most similar to Immigrants from Belarus are Immigrants from West Indies (4.7%, a difference of 0.090%), Puerto Rican (4.7%, a difference of 0.44%), Immigrants from Israel (4.8%, a difference of 0.88%), Albanian (4.8%, a difference of 0.90%), and U.S. Virgin Islander (4.6%, a difference of 2.1%).
| Demographics | Rating | Rank | 4 or more Vehicles in Household |
| Paraguayans | 0.0 /100 | #308 | Tragic 4.9% |
| Immigrants | Somalia | 0.0 /100 | #309 | Tragic 4.9% |
| Moroccans | 0.0 /100 | #310 | Tragic 4.9% |
| Houma | 0.0 /100 | #311 | Tragic 4.9% |
| Albanians | 0.0 /100 | #312 | Tragic 4.8% |
| Immigrants | Israel | 0.0 /100 | #313 | Tragic 4.8% |
| Immigrants | West Indies | 0.0 /100 | #314 | Tragic 4.7% |
| Immigrants | Belarus | 0.0 /100 | #315 | Tragic 4.7% |
| Puerto Ricans | 0.0 /100 | #316 | Tragic 4.7% |
| U.S. Virgin Islanders | 0.0 /100 | #317 | Tragic 4.6% |
| Jamaicans | 0.0 /100 | #318 | Tragic 4.6% |
| Haitians | 0.0 /100 | #319 | Tragic 4.6% |
| Immigrants | Haiti | 0.0 /100 | #320 | Tragic 4.5% |
| Ecuadorians | 0.0 /100 | #321 | Tragic 4.5% |
| Immigrants | Yemen | 0.0 /100 | #322 | Tragic 4.5% |