Immigrants from Sweden vs Immigrants from Belarus 4 or more Vehicles in Household
COMPARE
Immigrants from Sweden
Immigrants from Belarus
4 or more Vehicles in Household
4 or more Vehicles in Household Comparison
Immigrants from Sweden
Immigrants from Belarus
6.2%
4 OR MORE VEHICLES IN HOUSEHOLD
27.0/ 100
METRIC RATING
194th/ 347
METRIC RANK
4.7%
4 OR MORE VEHICLES IN HOUSEHOLD
0.0/ 100
METRIC RATING
315th/ 347
METRIC RANK
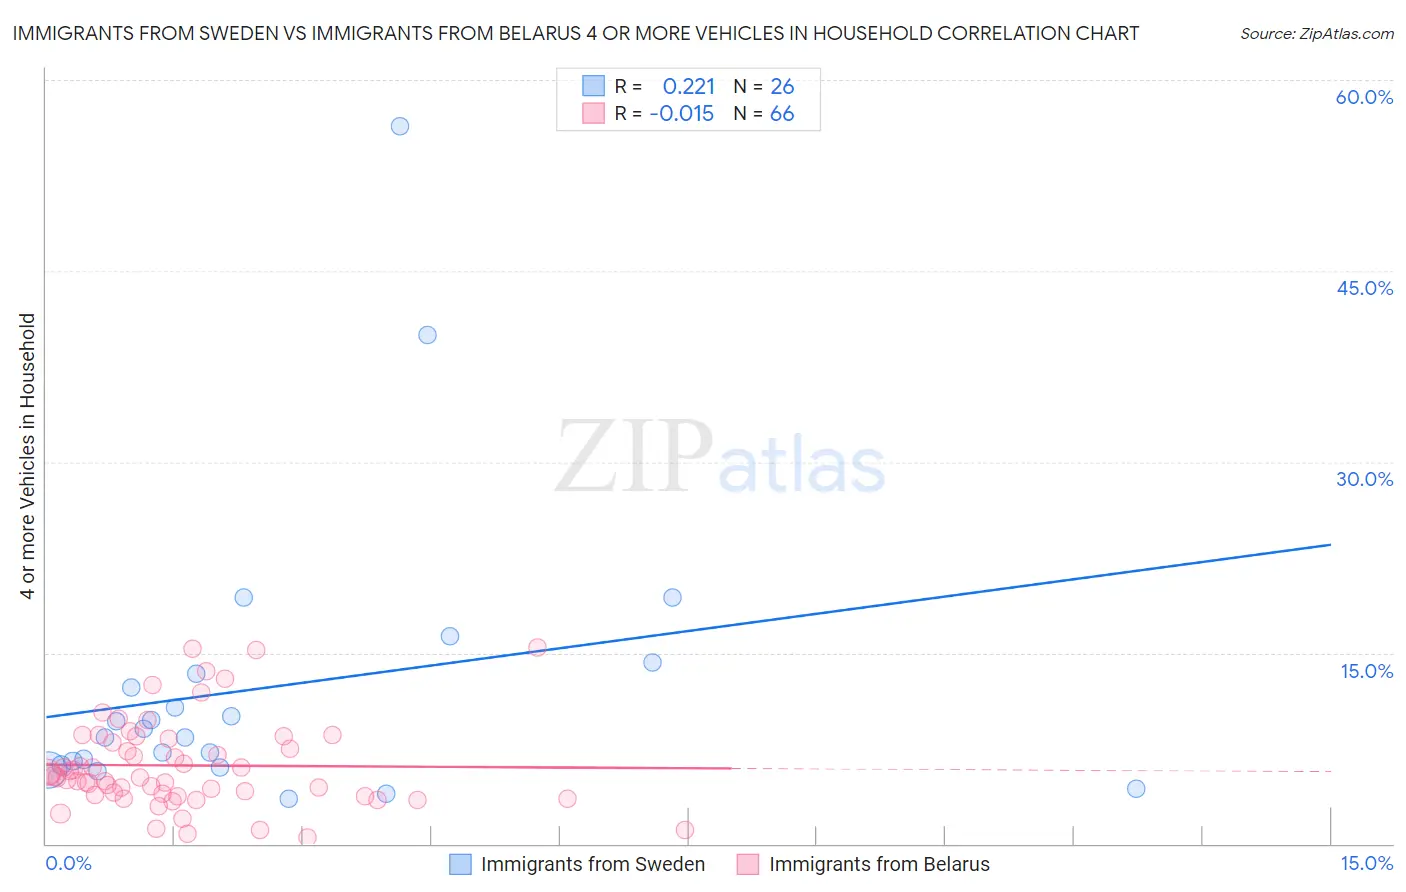
Immigrants from Sweden vs Immigrants from Belarus 4 or more Vehicles in Household Correlation Chart
The statistical analysis conducted on geographies consisting of 163,976,202 people shows a weak positive correlation between the proportion of Immigrants from Sweden and percentage of households with 4 or more vehicles available in the United States with a correlation coefficient (R) of 0.221 and weighted average of 6.2%. Similarly, the statistical analysis conducted on geographies consisting of 149,564,029 people shows no correlation between the proportion of Immigrants from Belarus and percentage of households with 4 or more vehicles available in the United States with a correlation coefficient (R) of -0.015 and weighted average of 4.7%, a difference of 30.0%.
4 or more Vehicles in Household Correlation Summary
| Measurement | Immigrants from Sweden | Immigrants from Belarus |
| Minimum | 3.6% | 0.52% |
| Maximum | 56.4% | 15.4% |
| Range | 52.8% | 14.9% |
| Mean | 12.3% | 6.1% |
| Median | 8.7% | 5.3% |
| Interquartile 25% (IQ1) | 6.2% | 3.9% |
| Interquartile 75% (IQ3) | 13.4% | 8.2% |
| Interquartile Range (IQR) | 7.2% | 4.3% |
| Standard Deviation (Sample) | 11.6% | 3.5% |
| Standard Deviation (Population) | 11.4% | 3.5% |
Similar Demographics by 4 or more Vehicles in Household
Demographics Similar to Immigrants from Sweden by 4 or more Vehicles in Household
In terms of 4 or more vehicles in household, the demographic groups most similar to Immigrants from Sweden are Argentinean (6.2%, a difference of 0.0%), Tsimshian (6.2%, a difference of 0.070%), Immigrants from Kuwait (6.2%, a difference of 0.13%), Immigrants from Sri Lanka (6.1%, a difference of 0.45%), and Romanian (6.2%, a difference of 0.47%).
| Demographics | Rating | Rank | 4 or more Vehicles in Household |
| Immigrants | South Africa | 35.4 /100 | #187 | Fair 6.2% |
| Kiowa | 34.7 /100 | #188 | Fair 6.2% |
| Immigrants | Eastern Asia | 33.3 /100 | #189 | Fair 6.2% |
| South Africans | 32.2 /100 | #190 | Fair 6.2% |
| Inupiat | 30.7 /100 | #191 | Fair 6.2% |
| Romanians | 30.7 /100 | #192 | Fair 6.2% |
| Immigrants | Kuwait | 28.0 /100 | #193 | Fair 6.2% |
| Immigrants | Sweden | 27.0 /100 | #194 | Fair 6.2% |
| Argentineans | 27.0 /100 | #195 | Fair 6.2% |
| Tsimshian | 26.4 /100 | #196 | Fair 6.2% |
| Immigrants | Sri Lanka | 23.7 /100 | #197 | Fair 6.1% |
| Immigrants | Portugal | 22.3 /100 | #198 | Fair 6.1% |
| Immigrants | Norway | 21.8 /100 | #199 | Fair 6.1% |
| Latvians | 21.7 /100 | #200 | Fair 6.1% |
| Egyptians | 21.4 /100 | #201 | Fair 6.1% |
Demographics Similar to Immigrants from Belarus by 4 or more Vehicles in Household
In terms of 4 or more vehicles in household, the demographic groups most similar to Immigrants from Belarus are Immigrants from West Indies (4.7%, a difference of 0.090%), Puerto Rican (4.7%, a difference of 0.44%), Immigrants from Israel (4.8%, a difference of 0.88%), Albanian (4.8%, a difference of 0.90%), and U.S. Virgin Islander (4.6%, a difference of 2.1%).
| Demographics | Rating | Rank | 4 or more Vehicles in Household |
| Paraguayans | 0.0 /100 | #308 | Tragic 4.9% |
| Immigrants | Somalia | 0.0 /100 | #309 | Tragic 4.9% |
| Moroccans | 0.0 /100 | #310 | Tragic 4.9% |
| Houma | 0.0 /100 | #311 | Tragic 4.9% |
| Albanians | 0.0 /100 | #312 | Tragic 4.8% |
| Immigrants | Israel | 0.0 /100 | #313 | Tragic 4.8% |
| Immigrants | West Indies | 0.0 /100 | #314 | Tragic 4.7% |
| Immigrants | Belarus | 0.0 /100 | #315 | Tragic 4.7% |
| Puerto Ricans | 0.0 /100 | #316 | Tragic 4.7% |
| U.S. Virgin Islanders | 0.0 /100 | #317 | Tragic 4.6% |
| Jamaicans | 0.0 /100 | #318 | Tragic 4.6% |
| Haitians | 0.0 /100 | #319 | Tragic 4.6% |
| Immigrants | Haiti | 0.0 /100 | #320 | Tragic 4.5% |
| Ecuadorians | 0.0 /100 | #321 | Tragic 4.5% |
| Immigrants | Yemen | 0.0 /100 | #322 | Tragic 4.5% |