Ghanaian vs Immigrants from Guyana 1 or more Vehicles in Household
COMPARE
Ghanaian
Immigrants from Guyana
1 or more Vehicles in Household
1 or more Vehicles in Household Comparison
Ghanaians
Immigrants from Guyana
83.6%
1 OR MORE VEHICLES IN HOUSEHOLD
0.0/ 100
METRIC RATING
317th/ 347
METRIC RANK
70.6%
1 OR MORE VEHICLES IN HOUSEHOLD
0.0/ 100
METRIC RATING
342nd/ 347
METRIC RANK
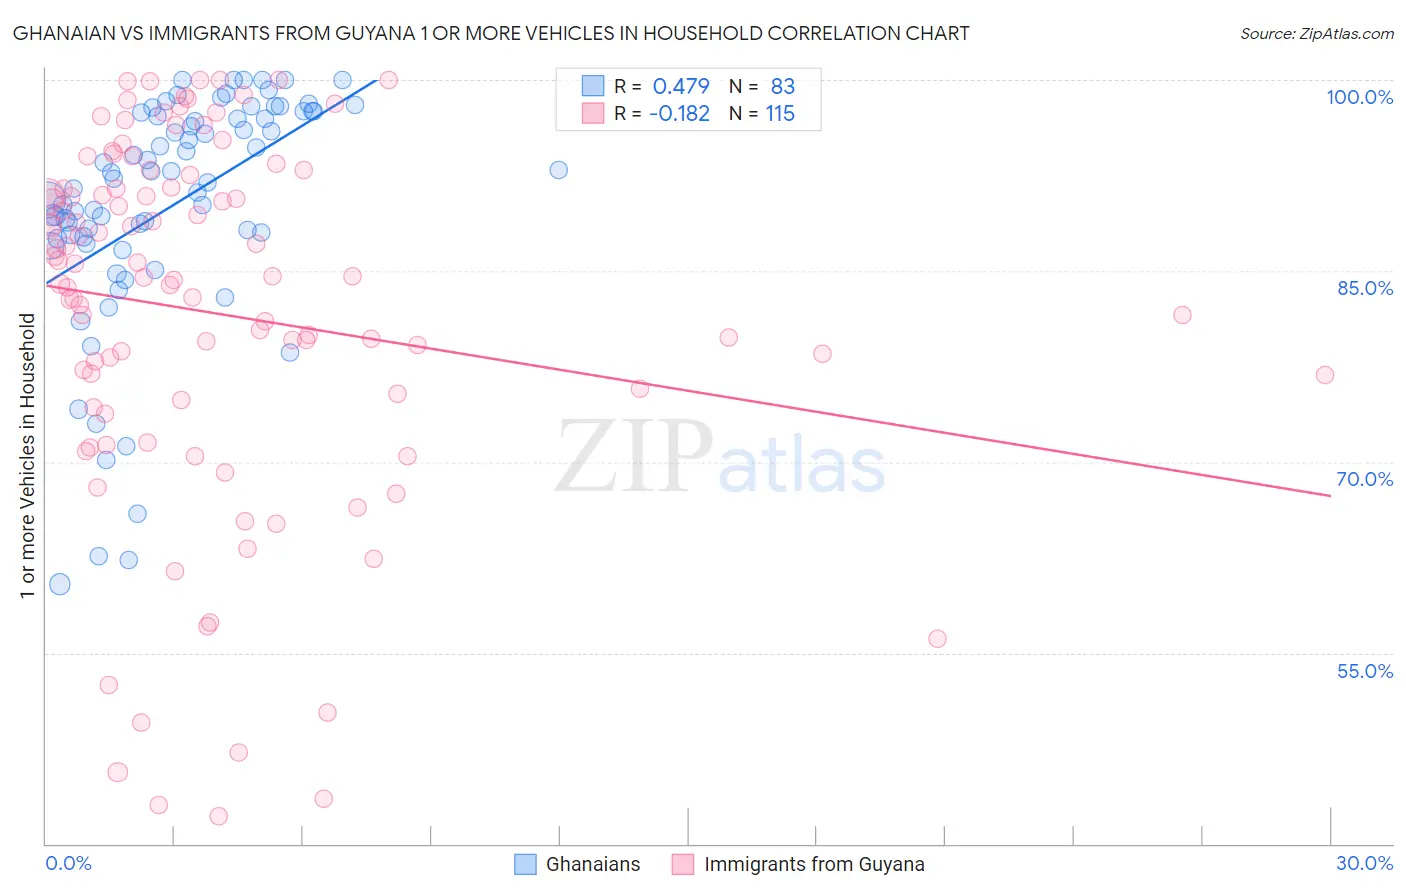
Ghanaian vs Immigrants from Guyana 1 or more Vehicles in Household Correlation Chart
The statistical analysis conducted on geographies consisting of 190,247,159 people shows a moderate positive correlation between the proportion of Ghanaians and percentage of households with 1 or more vehicles available in the United States with a correlation coefficient (R) of 0.479 and weighted average of 83.6%. Similarly, the statistical analysis conducted on geographies consisting of 183,508,680 people shows a poor negative correlation between the proportion of Immigrants from Guyana and percentage of households with 1 or more vehicles available in the United States with a correlation coefficient (R) of -0.182 and weighted average of 70.6%, a difference of 18.5%.
1 or more Vehicles in Household Correlation Summary
| Measurement | Ghanaian | Immigrants from Guyana |
| Minimum | 60.4% | 42.2% |
| Maximum | 100.0% | 100.0% |
| Range | 39.6% | 57.8% |
| Mean | 90.1% | 81.7% |
| Median | 92.3% | 84.4% |
| Interquartile 25% (IQ1) | 87.6% | 74.9% |
| Interquartile 75% (IQ3) | 97.4% | 91.6% |
| Interquartile Range (IQR) | 9.8% | 16.7% |
| Standard Deviation (Sample) | 9.3% | 14.3% |
| Standard Deviation (Population) | 9.2% | 14.3% |
Similar Demographics by 1 or more Vehicles in Household
Demographics Similar to Ghanaians by 1 or more Vehicles in Household
In terms of 1 or more vehicles in household, the demographic groups most similar to Ghanaians are Immigrants from Ghana (83.4%, a difference of 0.20%), Alaska Native (83.8%, a difference of 0.22%), Immigrants from Belarus (83.3%, a difference of 0.34%), Cypriot (84.4%, a difference of 0.91%), and Albanian (84.4%, a difference of 0.98%).
| Demographics | Rating | Rank | 1 or more Vehicles in Household |
| U.S. Virgin Islanders | 0.0 /100 | #310 | Tragic 84.6% |
| Puerto Ricans | 0.0 /100 | #311 | Tragic 84.6% |
| Cape Verdeans | 0.0 /100 | #312 | Tragic 84.5% |
| Immigrants | Israel | 0.0 /100 | #313 | Tragic 84.5% |
| Albanians | 0.0 /100 | #314 | Tragic 84.4% |
| Cypriots | 0.0 /100 | #315 | Tragic 84.4% |
| Alaska Natives | 0.0 /100 | #316 | Tragic 83.8% |
| Ghanaians | 0.0 /100 | #317 | Tragic 83.6% |
| Immigrants | Ghana | 0.0 /100 | #318 | Tragic 83.4% |
| Immigrants | Belarus | 0.0 /100 | #319 | Tragic 83.3% |
| Soviet Union | 0.0 /100 | #320 | Tragic 82.7% |
| Jamaicans | 0.0 /100 | #321 | Tragic 82.1% |
| Immigrants | Cabo Verde | 0.0 /100 | #322 | Tragic 81.6% |
| Immigrants | Yemen | 0.0 /100 | #323 | Tragic 80.5% |
| Immigrants | Caribbean | 0.0 /100 | #324 | Tragic 80.4% |
Demographics Similar to Immigrants from Guyana by 1 or more Vehicles in Household
In terms of 1 or more vehicles in household, the demographic groups most similar to Immigrants from Guyana are Immigrants from Barbados (70.6%, a difference of 0.010%), Dominican (70.7%, a difference of 0.15%), British West Indian (70.4%, a difference of 0.31%), Guyanese (70.8%, a difference of 0.34%), and Inupiat (71.5%, a difference of 1.4%).
| Demographics | Rating | Rank | 1 or more Vehicles in Household |
| Immigrants | Ecuador | 0.0 /100 | #333 | Tragic 76.2% |
| Immigrants | Bangladesh | 0.0 /100 | #334 | Tragic 74.3% |
| Barbadians | 0.0 /100 | #335 | Tragic 74.0% |
| Vietnamese | 0.0 /100 | #336 | Tragic 73.8% |
| Immigrants | Uzbekistan | 0.0 /100 | #337 | Tragic 73.4% |
| Inupiat | 0.0 /100 | #338 | Tragic 71.5% |
| Guyanese | 0.0 /100 | #339 | Tragic 70.8% |
| Dominicans | 0.0 /100 | #340 | Tragic 70.7% |
| Immigrants | Barbados | 0.0 /100 | #341 | Tragic 70.6% |
| Immigrants | Guyana | 0.0 /100 | #342 | Tragic 70.6% |
| British West Indians | 0.0 /100 | #343 | Tragic 70.4% |
| Immigrants | Dominican Republic | 0.0 /100 | #344 | Tragic 68.6% |
| Immigrants | St. Vincent and the Grenadines | 0.0 /100 | #345 | Tragic 64.7% |
| Immigrants | Grenada | 0.0 /100 | #346 | Tragic 62.7% |
| Yup'ik | 0.0 /100 | #347 | Tragic 58.4% |