Bhutanese vs Immigrants from Guyana 1 or more Vehicles in Household
COMPARE
Bhutanese
Immigrants from Guyana
1 or more Vehicles in Household
1 or more Vehicles in Household Comparison
Bhutanese
Immigrants from Guyana
91.4%
1 OR MORE VEHICLES IN HOUSEHOLD
99.2/ 100
METRIC RATING
92nd/ 347
METRIC RANK
70.6%
1 OR MORE VEHICLES IN HOUSEHOLD
0.0/ 100
METRIC RATING
342nd/ 347
METRIC RANK
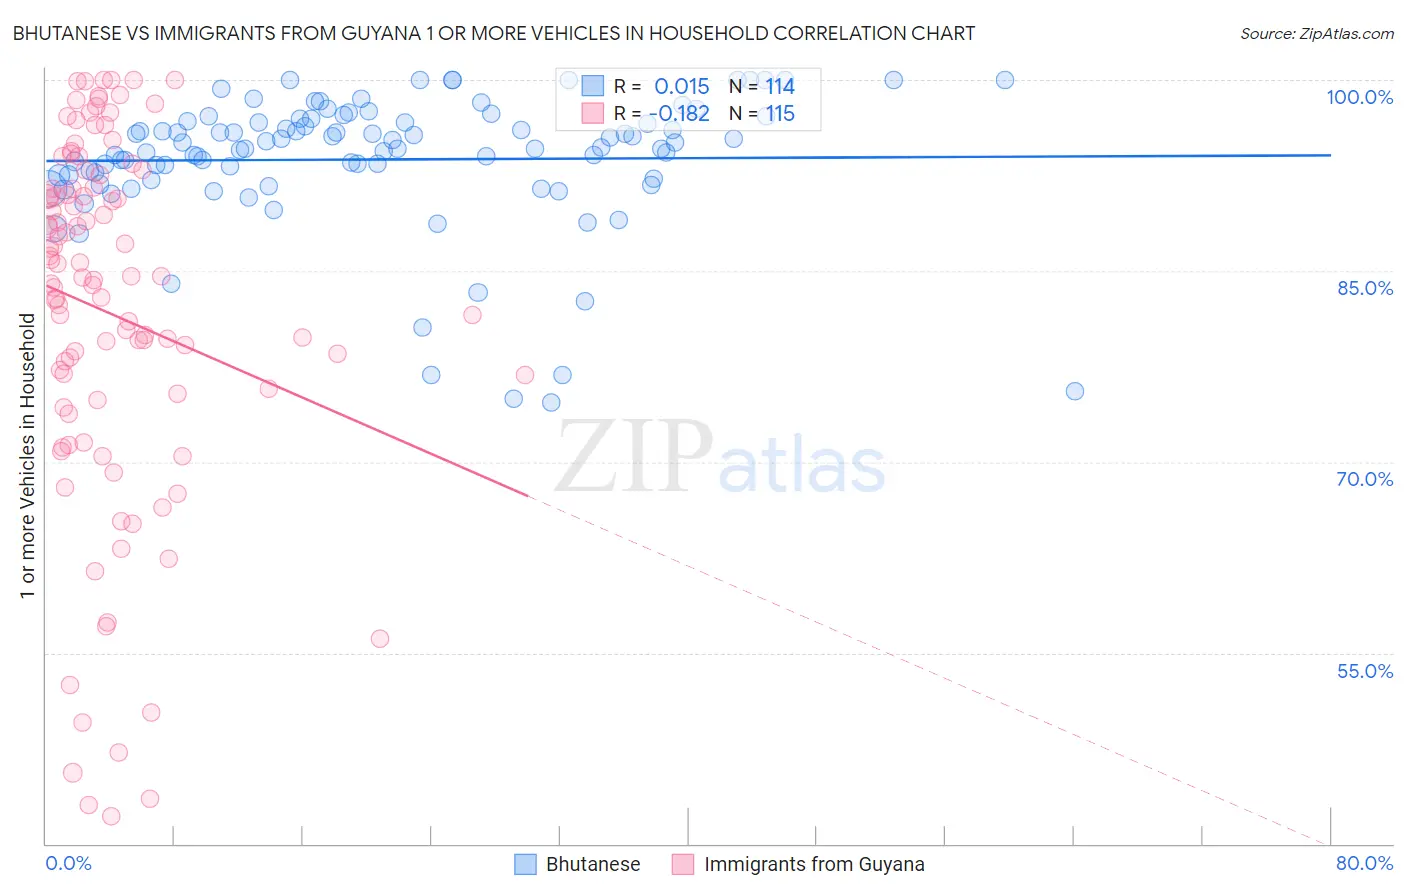
Bhutanese vs Immigrants from Guyana 1 or more Vehicles in Household Correlation Chart
The statistical analysis conducted on geographies consisting of 455,231,093 people shows no correlation between the proportion of Bhutanese and percentage of households with 1 or more vehicles available in the United States with a correlation coefficient (R) of 0.015 and weighted average of 91.4%. Similarly, the statistical analysis conducted on geographies consisting of 183,508,680 people shows a poor negative correlation between the proportion of Immigrants from Guyana and percentage of households with 1 or more vehicles available in the United States with a correlation coefficient (R) of -0.182 and weighted average of 70.6%, a difference of 29.5%.
1 or more Vehicles in Household Correlation Summary
| Measurement | Bhutanese | Immigrants from Guyana |
| Minimum | 74.7% | 42.2% |
| Maximum | 100.0% | 100.0% |
| Range | 25.3% | 57.8% |
| Mean | 93.8% | 81.7% |
| Median | 94.7% | 84.4% |
| Interquartile 25% (IQ1) | 92.2% | 74.9% |
| Interquartile 75% (IQ3) | 96.8% | 91.6% |
| Interquartile Range (IQR) | 4.6% | 16.7% |
| Standard Deviation (Sample) | 5.3% | 14.3% |
| Standard Deviation (Population) | 5.3% | 14.3% |
Similar Demographics by 1 or more Vehicles in Household
Demographics Similar to Bhutanese by 1 or more Vehicles in Household
In terms of 1 or more vehicles in household, the demographic groups most similar to Bhutanese are Immigrants from North America (91.4%, a difference of 0.0%), Immigrants from Germany (91.4%, a difference of 0.010%), Spanish American (91.4%, a difference of 0.010%), Bangladeshi (91.4%, a difference of 0.010%), and Immigrants from Canada (91.4%, a difference of 0.010%).
| Demographics | Rating | Rank | 1 or more Vehicles in Household |
| Tsimshian | 99.3 /100 | #85 | Exceptional 91.4% |
| Osage | 99.2 /100 | #86 | Exceptional 91.4% |
| Immigrants | Germany | 99.2 /100 | #87 | Exceptional 91.4% |
| Spanish Americans | 99.2 /100 | #88 | Exceptional 91.4% |
| Bangladeshis | 99.2 /100 | #89 | Exceptional 91.4% |
| Immigrants | Canada | 99.2 /100 | #90 | Exceptional 91.4% |
| Immigrants | Jordan | 99.2 /100 | #91 | Exceptional 91.4% |
| Bhutanese | 99.2 /100 | #92 | Exceptional 91.4% |
| Immigrants | North America | 99.2 /100 | #93 | Exceptional 91.4% |
| Immigrants | Cuba | 99.1 /100 | #94 | Exceptional 91.3% |
| Austrians | 99.0 /100 | #95 | Exceptional 91.3% |
| Potawatomi | 99.0 /100 | #96 | Exceptional 91.3% |
| Pakistanis | 99.0 /100 | #97 | Exceptional 91.3% |
| Slavs | 98.7 /100 | #98 | Exceptional 91.2% |
| Immigrants | Bolivia | 98.6 /100 | #99 | Exceptional 91.2% |
Demographics Similar to Immigrants from Guyana by 1 or more Vehicles in Household
In terms of 1 or more vehicles in household, the demographic groups most similar to Immigrants from Guyana are Immigrants from Barbados (70.6%, a difference of 0.010%), Dominican (70.7%, a difference of 0.15%), British West Indian (70.4%, a difference of 0.31%), Guyanese (70.8%, a difference of 0.34%), and Inupiat (71.5%, a difference of 1.4%).
| Demographics | Rating | Rank | 1 or more Vehicles in Household |
| Immigrants | Ecuador | 0.0 /100 | #333 | Tragic 76.2% |
| Immigrants | Bangladesh | 0.0 /100 | #334 | Tragic 74.3% |
| Barbadians | 0.0 /100 | #335 | Tragic 74.0% |
| Vietnamese | 0.0 /100 | #336 | Tragic 73.8% |
| Immigrants | Uzbekistan | 0.0 /100 | #337 | Tragic 73.4% |
| Inupiat | 0.0 /100 | #338 | Tragic 71.5% |
| Guyanese | 0.0 /100 | #339 | Tragic 70.8% |
| Dominicans | 0.0 /100 | #340 | Tragic 70.7% |
| Immigrants | Barbados | 0.0 /100 | #341 | Tragic 70.6% |
| Immigrants | Guyana | 0.0 /100 | #342 | Tragic 70.6% |
| British West Indians | 0.0 /100 | #343 | Tragic 70.4% |
| Immigrants | Dominican Republic | 0.0 /100 | #344 | Tragic 68.6% |
| Immigrants | St. Vincent and the Grenadines | 0.0 /100 | #345 | Tragic 64.7% |
| Immigrants | Grenada | 0.0 /100 | #346 | Tragic 62.7% |
| Yup'ik | 0.0 /100 | #347 | Tragic 58.4% |