Ecuadorian vs Mongolian Master's Degree
COMPARE
Ecuadorian
Mongolian
Master's Degree
Master's Degree Comparison
Ecuadorians
Mongolians
14.0%
MASTER'S DEGREE
12.6/ 100
METRIC RATING
222nd/ 347
METRIC RANK
19.4%
MASTER'S DEGREE
100.0/ 100
METRIC RATING
37th/ 347
METRIC RANK
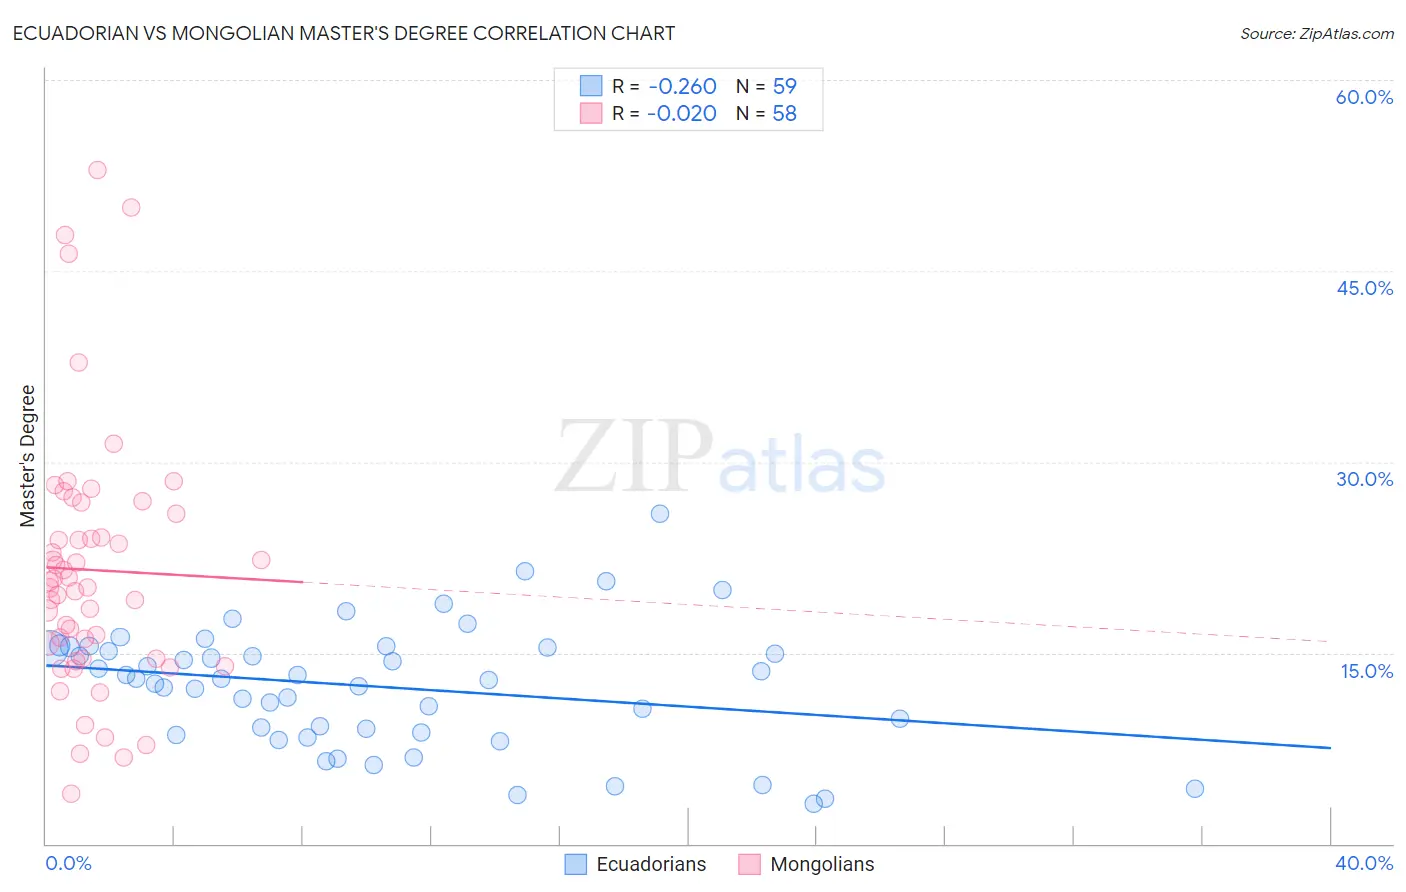
Ecuadorian vs Mongolian Master's Degree Correlation Chart
The statistical analysis conducted on geographies consisting of 317,754,376 people shows a weak negative correlation between the proportion of Ecuadorians and percentage of population with at least master's degree education in the United States with a correlation coefficient (R) of -0.260 and weighted average of 14.0%. Similarly, the statistical analysis conducted on geographies consisting of 140,335,319 people shows no correlation between the proportion of Mongolians and percentage of population with at least master's degree education in the United States with a correlation coefficient (R) of -0.020 and weighted average of 19.4%, a difference of 38.6%.
Master's Degree Correlation Summary
| Measurement | Ecuadorian | Mongolian |
| Minimum | 3.1% | 3.9% |
| Maximum | 25.9% | 53.0% |
| Range | 22.8% | 49.0% |
| Mean | 12.3% | 21.5% |
| Median | 12.9% | 20.4% |
| Interquartile 25% (IQ1) | 8.8% | 14.5% |
| Interquartile 75% (IQ3) | 15.5% | 26.0% |
| Interquartile Range (IQR) | 6.7% | 11.4% |
| Standard Deviation (Sample) | 4.8% | 10.1% |
| Standard Deviation (Population) | 4.8% | 10.0% |
Similar Demographics by Master's Degree
Demographics Similar to Ecuadorians by Master's Degree
In terms of master's degree, the demographic groups most similar to Ecuadorians are Korean (14.0%, a difference of 0.030%), German (14.0%, a difference of 0.17%), Immigrants from South Eastern Asia (14.0%, a difference of 0.20%), Immigrants from Grenada (14.0%, a difference of 0.25%), and Norwegian (14.0%, a difference of 0.32%).
| Demographics | Rating | Rank | Master's Degree |
| Immigrants | Vietnam | 16.1 /100 | #215 | Poor 14.1% |
| Immigrants | Somalia | 15.8 /100 | #216 | Poor 14.1% |
| Immigrants | Trinidad and Tobago | 15.8 /100 | #217 | Poor 14.1% |
| French Canadians | 14.9 /100 | #218 | Poor 14.1% |
| Norwegians | 13.6 /100 | #219 | Poor 14.0% |
| Germans | 13.1 /100 | #220 | Poor 14.0% |
| Koreans | 12.7 /100 | #221 | Poor 14.0% |
| Ecuadorians | 12.6 /100 | #222 | Poor 14.0% |
| Immigrants | South Eastern Asia | 11.9 /100 | #223 | Poor 14.0% |
| Immigrants | Grenada | 11.8 /100 | #224 | Poor 14.0% |
| Portuguese | 11.2 /100 | #225 | Poor 13.9% |
| Immigrants | St. Vincent and the Grenadines | 11.0 /100 | #226 | Poor 13.9% |
| Immigrants | West Indies | 9.8 /100 | #227 | Tragic 13.9% |
| Whites/Caucasians | 9.1 /100 | #228 | Tragic 13.8% |
| British West Indians | 8.8 /100 | #229 | Tragic 13.8% |
Demographics Similar to Mongolians by Master's Degree
In terms of master's degree, the demographic groups most similar to Mongolians are Immigrants from Russia (19.4%, a difference of 0.040%), Immigrants from Northern Europe (19.5%, a difference of 0.41%), Bolivian (19.3%, a difference of 0.69%), Immigrants from Denmark (19.5%, a difference of 0.74%), and Russian (19.5%, a difference of 0.77%).
| Demographics | Rating | Rank | Master's Degree |
| Immigrants | Turkey | 100.0 /100 | #30 | Exceptional 19.7% |
| Immigrants | Korea | 100.0 /100 | #31 | Exceptional 19.7% |
| Burmese | 100.0 /100 | #32 | Exceptional 19.7% |
| Russians | 100.0 /100 | #33 | Exceptional 19.5% |
| Immigrants | Denmark | 100.0 /100 | #34 | Exceptional 19.5% |
| Immigrants | Northern Europe | 100.0 /100 | #35 | Exceptional 19.5% |
| Immigrants | Russia | 100.0 /100 | #36 | Exceptional 19.4% |
| Mongolians | 100.0 /100 | #37 | Exceptional 19.4% |
| Bolivians | 100.0 /100 | #38 | Exceptional 19.3% |
| Immigrants | Spain | 100.0 /100 | #39 | Exceptional 19.1% |
| Immigrants | Bolivia | 100.0 /100 | #40 | Exceptional 19.1% |
| Immigrants | Latvia | 100.0 /100 | #41 | Exceptional 19.1% |
| Immigrants | Saudi Arabia | 100.0 /100 | #42 | Exceptional 19.0% |
| Immigrants | Greece | 100.0 /100 | #43 | Exceptional 19.0% |
| Immigrants | Malaysia | 100.0 /100 | #44 | Exceptional 18.9% |