Eastern European vs Korean 2 or more Vehicles in Household
COMPARE
Eastern European
Korean
2 or more Vehicles in Household
2 or more Vehicles in Household Comparison
Eastern Europeans
Koreans
54.8%
2 OR MORE VEHICLES IN HOUSEHOLD
27.5/ 100
METRIC RATING
189th/ 347
METRIC RANK
61.0%
2 OR MORE VEHICLES IN HOUSEHOLD
100.0/ 100
METRIC RATING
21st/ 347
METRIC RANK
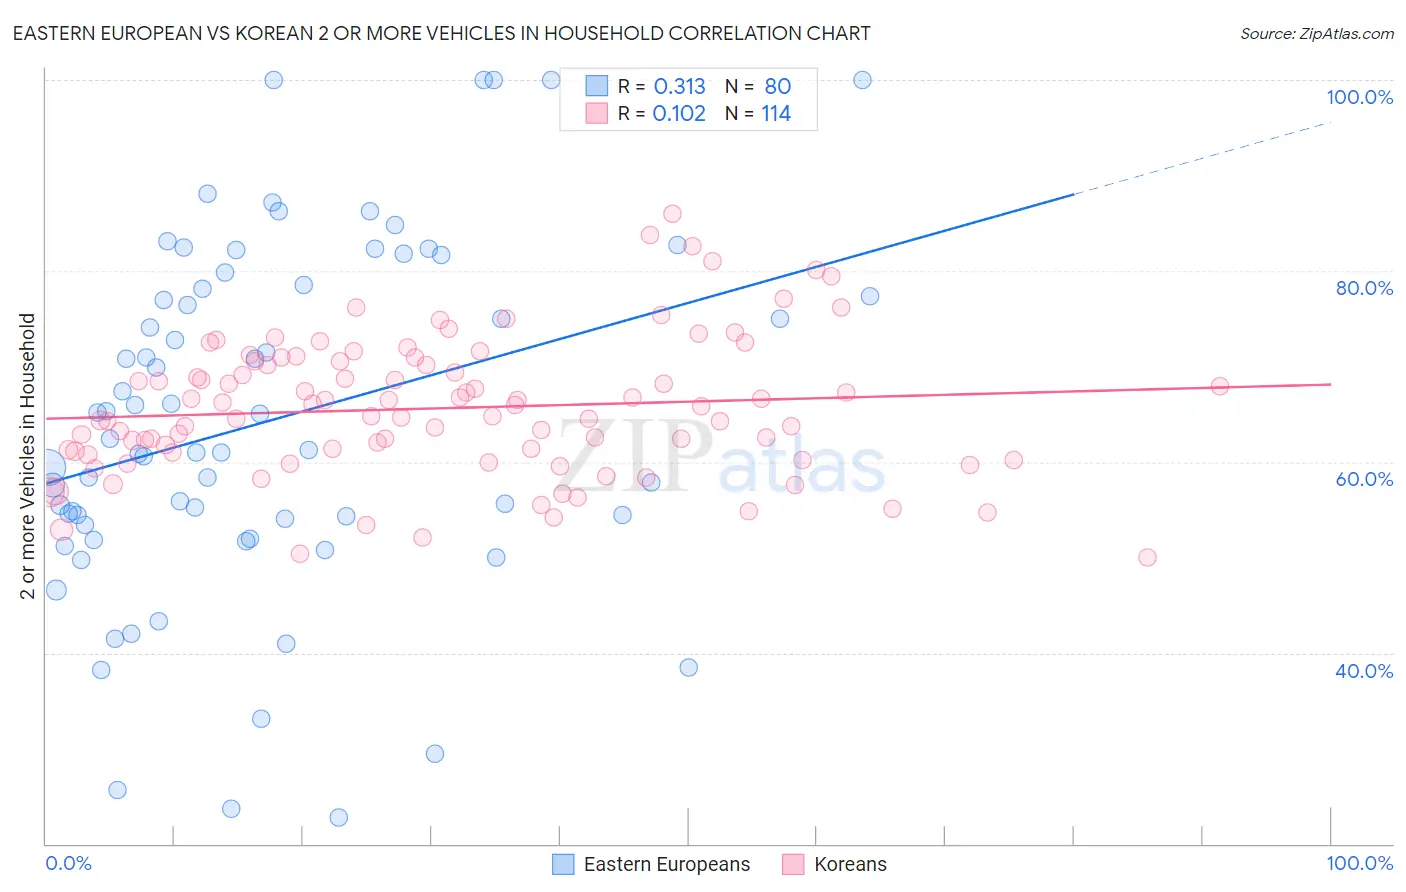
Eastern European vs Korean 2 or more Vehicles in Household Correlation Chart
The statistical analysis conducted on geographies consisting of 460,977,984 people shows a mild positive correlation between the proportion of Eastern Europeans and percentage of households with 2 or more vehicles available in the United States with a correlation coefficient (R) of 0.313 and weighted average of 54.8%. Similarly, the statistical analysis conducted on geographies consisting of 510,458,267 people shows a poor positive correlation between the proportion of Koreans and percentage of households with 2 or more vehicles available in the United States with a correlation coefficient (R) of 0.102 and weighted average of 61.0%, a difference of 11.3%.
2 or more Vehicles in Household Correlation Summary
| Measurement | Eastern European | Korean |
| Minimum | 22.8% | 50.0% |
| Maximum | 100.0% | 86.1% |
| Range | 77.2% | 36.1% |
| Mean | 64.3% | 65.6% |
| Median | 61.9% | 65.3% |
| Interquartile 25% (IQ1) | 53.7% | 61.0% |
| Interquartile 75% (IQ3) | 78.3% | 70.5% |
| Interquartile Range (IQR) | 24.6% | 9.5% |
| Standard Deviation (Sample) | 18.3% | 7.2% |
| Standard Deviation (Population) | 18.2% | 7.2% |
Similar Demographics by 2 or more Vehicles in Household
Demographics Similar to Eastern Europeans by 2 or more Vehicles in Household
In terms of 2 or more vehicles in household, the demographic groups most similar to Eastern Europeans are Russian (54.8%, a difference of 0.060%), Immigrants (54.7%, a difference of 0.13%), Marshallese (54.9%, a difference of 0.15%), Immigrants from Romania (54.7%, a difference of 0.20%), and Immigrants from Japan (54.7%, a difference of 0.22%).
| Demographics | Rating | Rank | 2 or more Vehicles in Household |
| Cree | 38.2 /100 | #182 | Fair 55.1% |
| Immigrants | Cameroon | 37.3 /100 | #183 | Fair 55.1% |
| Apache | 36.7 /100 | #184 | Fair 55.1% |
| Arabs | 35.9 /100 | #185 | Fair 55.0% |
| Peruvians | 33.7 /100 | #186 | Fair 55.0% |
| Immigrants | Uganda | 33.4 /100 | #187 | Fair 55.0% |
| Marshallese | 30.5 /100 | #188 | Fair 54.9% |
| Eastern Europeans | 27.5 /100 | #189 | Fair 54.8% |
| Russians | 26.3 /100 | #190 | Fair 54.8% |
| Immigrants | Immigrants | 25.0 /100 | #191 | Fair 54.7% |
| Immigrants | Romania | 23.8 /100 | #192 | Fair 54.7% |
| Immigrants | Japan | 23.4 /100 | #193 | Fair 54.7% |
| Central Americans | 23.0 /100 | #194 | Fair 54.7% |
| Iroquois | 22.6 /100 | #195 | Fair 54.7% |
| Immigrants | Poland | 19.3 /100 | #196 | Poor 54.6% |
Demographics Similar to Koreans by 2 or more Vehicles in Household
In terms of 2 or more vehicles in household, the demographic groups most similar to Koreans are Sri Lankan (61.0%, a difference of 0.040%), Swiss (61.0%, a difference of 0.040%), Scotch-Irish (60.9%, a difference of 0.070%), Immigrants from Vietnam (60.9%, a difference of 0.11%), and White/Caucasian (60.8%, a difference of 0.26%).
| Demographics | Rating | Rank | 2 or more Vehicles in Household |
| Czechs | 100.0 /100 | #14 | Exceptional 61.5% |
| Nepalese | 100.0 /100 | #15 | Exceptional 61.4% |
| Native Hawaiians | 100.0 /100 | #16 | Exceptional 61.4% |
| Basques | 100.0 /100 | #17 | Exceptional 61.4% |
| Europeans | 100.0 /100 | #18 | Exceptional 61.4% |
| Scottish | 100.0 /100 | #19 | Exceptional 61.2% |
| Sri Lankans | 100.0 /100 | #20 | Exceptional 61.0% |
| Koreans | 100.0 /100 | #21 | Exceptional 61.0% |
| Swiss | 100.0 /100 | #22 | Exceptional 61.0% |
| Scotch-Irish | 100.0 /100 | #23 | Exceptional 60.9% |
| Immigrants | Vietnam | 100.0 /100 | #24 | Exceptional 60.9% |
| Whites/Caucasians | 100.0 /100 | #25 | Exceptional 60.8% |
| Welsh | 100.0 /100 | #26 | Exceptional 60.8% |
| Assyrians/Chaldeans/Syriacs | 100.0 /100 | #27 | Exceptional 60.5% |
| Guamanians/Chamorros | 100.0 /100 | #28 | Exceptional 60.5% |