Taiwanese vs Navajo No Vehicles in Household
COMPARE
Taiwanese
Navajo
No Vehicles in Household
No Vehicles in Household Comparison
Taiwanese
Navajo
11.7%
NO VEHICLES IN HOUSEHOLD
2.8/ 100
METRIC RATING
239th/ 347
METRIC RANK
9.4%
NO VEHICLES IN HOUSEHOLD
94.2/ 100
METRIC RATING
115th/ 347
METRIC RANK
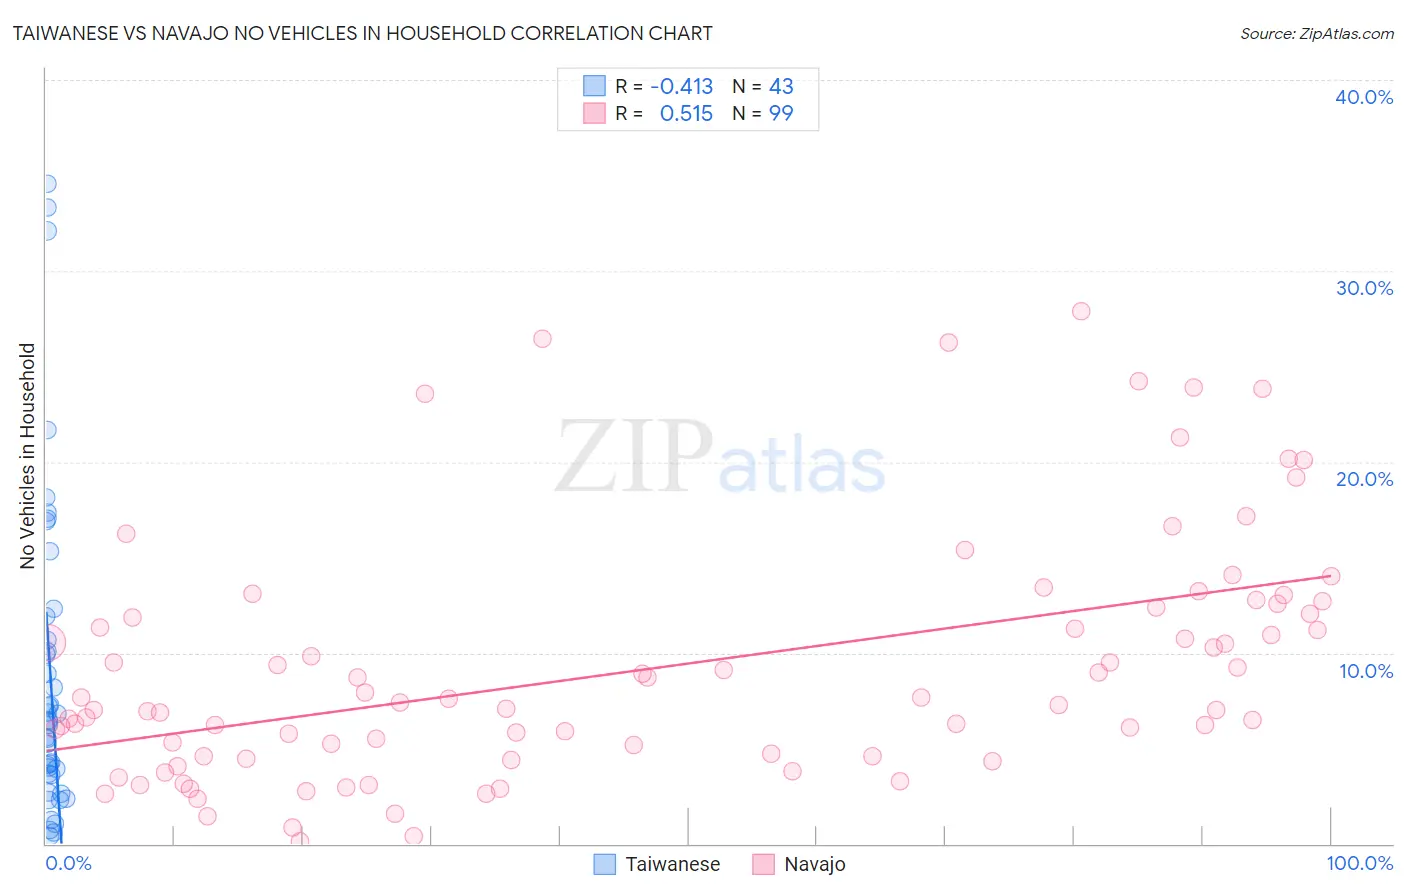
Taiwanese vs Navajo No Vehicles in Household Correlation Chart
The statistical analysis conducted on geographies consisting of 31,685,560 people shows a moderate negative correlation between the proportion of Taiwanese and percentage of households with no vehicle available in the United States with a correlation coefficient (R) of -0.413 and weighted average of 11.7%. Similarly, the statistical analysis conducted on geographies consisting of 224,409,454 people shows a substantial positive correlation between the proportion of Navajo and percentage of households with no vehicle available in the United States with a correlation coefficient (R) of 0.515 and weighted average of 9.4%, a difference of 23.7%.
No Vehicles in Household Correlation Summary
| Measurement | Taiwanese | Navajo |
| Minimum | 0.39% | 0.12% |
| Maximum | 34.6% | 27.9% |
| Range | 34.2% | 27.8% |
| Mean | 9.0% | 9.3% |
| Median | 6.4% | 7.4% |
| Interquartile 25% (IQ1) | 3.6% | 4.6% |
| Interquartile 75% (IQ3) | 11.9% | 12.3% |
| Interquartile Range (IQR) | 8.3% | 7.8% |
| Standard Deviation (Sample) | 8.6% | 6.3% |
| Standard Deviation (Population) | 8.5% | 6.3% |
Similar Demographics by No Vehicles in Household
Demographics Similar to Taiwanese by No Vehicles in Household
In terms of no vehicles in household, the demographic groups most similar to Taiwanese are Immigrants (11.7%, a difference of 0.060%), Eastern European (11.7%, a difference of 0.070%), Turkish (11.7%, a difference of 0.18%), Russian (11.6%, a difference of 0.46%), and Ute (11.6%, a difference of 0.51%).
| Demographics | Rating | Rank | No Vehicles in Household |
| Immigrants | Turkey | 4.8 /100 | #232 | Tragic 11.5% |
| Houma | 4.7 /100 | #233 | Tragic 11.5% |
| Immigrants | Peru | 4.5 /100 | #234 | Tragic 11.5% |
| Kiowa | 4.0 /100 | #235 | Tragic 11.5% |
| Cree | 3.5 /100 | #236 | Tragic 11.6% |
| Ute | 3.3 /100 | #237 | Tragic 11.6% |
| Russians | 3.2 /100 | #238 | Tragic 11.6% |
| Taiwanese | 2.8 /100 | #239 | Tragic 11.7% |
| Immigrants | Immigrants | 2.7 /100 | #240 | Tragic 11.7% |
| Eastern Europeans | 2.7 /100 | #241 | Tragic 11.7% |
| Turks | 2.6 /100 | #242 | Tragic 11.7% |
| Cheyenne | 2.4 /100 | #243 | Tragic 11.7% |
| Immigrants | Portugal | 2.2 /100 | #244 | Tragic 11.7% |
| Immigrants | Honduras | 2.1 /100 | #245 | Tragic 11.8% |
| Menominee | 2.0 /100 | #246 | Tragic 11.8% |
Demographics Similar to Navajo by No Vehicles in Household
In terms of no vehicles in household, the demographic groups most similar to Navajo are Serbian (9.4%, a difference of 0.070%), Japanese (9.4%, a difference of 0.070%), Chippewa (9.4%, a difference of 0.24%), Immigrants from Netherlands (9.4%, a difference of 0.49%), and Armenian (9.4%, a difference of 0.59%).
| Demographics | Rating | Rank | No Vehicles in Household |
| Mexican American Indians | 97.6 /100 | #108 | Exceptional 9.1% |
| Maltese | 97.6 /100 | #109 | Exceptional 9.1% |
| Delaware | 97.2 /100 | #110 | Exceptional 9.2% |
| Immigrants | Kuwait | 95.1 /100 | #111 | Exceptional 9.4% |
| Armenians | 95.0 /100 | #112 | Exceptional 9.4% |
| Immigrants | Netherlands | 94.8 /100 | #113 | Exceptional 9.4% |
| Serbians | 94.3 /100 | #114 | Exceptional 9.4% |
| Navajo | 94.2 /100 | #115 | Exceptional 9.4% |
| Japanese | 94.1 /100 | #116 | Exceptional 9.4% |
| Chippewa | 93.8 /100 | #117 | Exceptional 9.4% |
| Greeks | 92.9 /100 | #118 | Exceptional 9.5% |
| Fijians | 92.7 /100 | #119 | Exceptional 9.5% |
| Immigrants | Thailand | 92.6 /100 | #120 | Exceptional 9.5% |
| Puget Sound Salish | 92.4 /100 | #121 | Exceptional 9.5% |
| Costa Ricans | 92.3 /100 | #122 | Exceptional 9.5% |