Dominican vs Navajo Unemployment Among Ages 45 to 54 years
COMPARE
Dominican
Navajo
Unemployment Among Ages 45 to 54 years
Unemployment Among Ages 45 to 54 years Comparison
Dominicans
Navajo
6.2%
UNEMPLOYMENT AMONG AGES 45 TO 54 YEARS
0.0/ 100
METRIC RATING
327th/ 347
METRIC RANK
6.7%
UNEMPLOYMENT AMONG AGES 45 TO 54 YEARS
0.0/ 100
METRIC RATING
335th/ 347
METRIC RANK
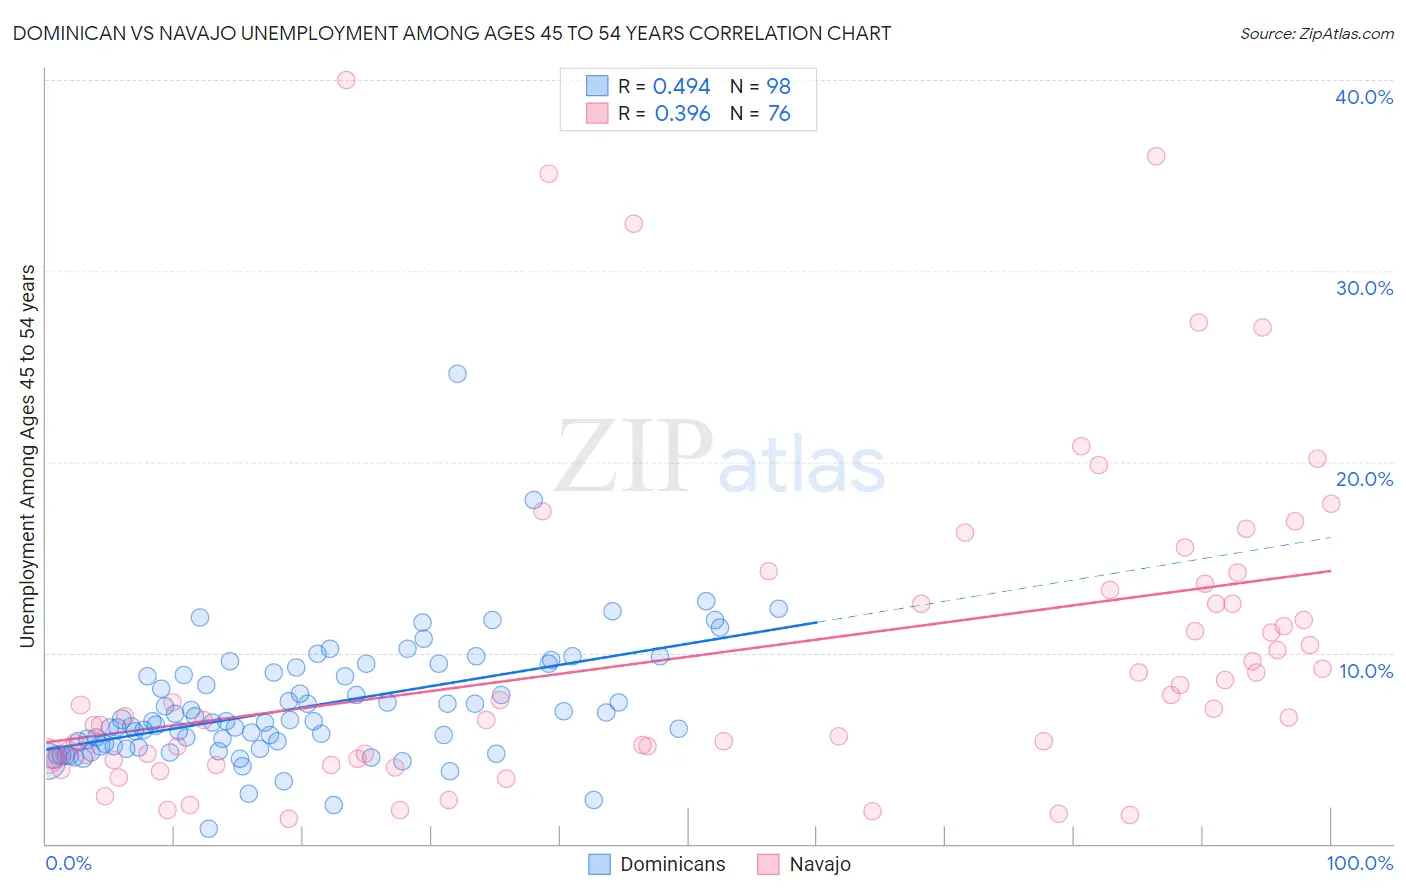
Dominican vs Navajo Unemployment Among Ages 45 to 54 years Correlation Chart
The statistical analysis conducted on geographies consisting of 346,800,593 people shows a moderate positive correlation between the proportion of Dominicans and unemployment rate among population between the ages 45 and 54 in the United States with a correlation coefficient (R) of 0.494 and weighted average of 6.2%. Similarly, the statistical analysis conducted on geographies consisting of 220,825,201 people shows a mild positive correlation between the proportion of Navajo and unemployment rate among population between the ages 45 and 54 in the United States with a correlation coefficient (R) of 0.396 and weighted average of 6.7%, a difference of 7.3%.
Unemployment Among Ages 45 to 54 years Correlation Summary
| Measurement | Dominican | Navajo |
| Minimum | 0.80% | 1.3% |
| Maximum | 24.6% | 40.0% |
| Range | 23.8% | 38.7% |
| Mean | 7.1% | 10.1% |
| Median | 6.4% | 7.2% |
| Interquartile 25% (IQ1) | 5.0% | 4.5% |
| Interquartile 75% (IQ3) | 8.8% | 13.0% |
| Interquartile Range (IQR) | 3.8% | 8.4% |
| Standard Deviation (Sample) | 3.2% | 8.5% |
| Standard Deviation (Population) | 3.2% | 8.4% |
Demographics Similar to Dominicans and Navajo by Unemployment Among Ages 45 to 54 years
In terms of unemployment among ages 45 to 54 years, the demographic groups most similar to Dominicans are Ute (6.2%, a difference of 0.21%), Pueblo (6.2%, a difference of 0.21%), Alaska Native (6.3%, a difference of 0.91%), Immigrants from Dominican Republic (6.3%, a difference of 1.0%), and Immigrants from Armenia (6.1%, a difference of 1.1%). Similarly, the demographic groups most similar to Navajo are Sioux (6.6%, a difference of 0.48%), Immigrants from Yemen (6.5%, a difference of 1.5%), Puerto Rican (6.8%, a difference of 2.2%), Pima (6.4%, a difference of 3.3%), and Apache (7.0%, a difference of 5.6%).
| Demographics | Rating | Rank | Unemployment Among Ages 45 to 54 years |
| Yakama | 0.0 /100 | #321 | Tragic 5.7% |
| Immigrants | Azores | 0.0 /100 | #322 | Tragic 5.7% |
| Immigrants | Cabo Verde | 0.0 /100 | #323 | Tragic 5.9% |
| Natives/Alaskans | 0.0 /100 | #324 | Tragic 6.1% |
| Immigrants | Armenia | 0.0 /100 | #325 | Tragic 6.1% |
| Ute | 0.0 /100 | #326 | Tragic 6.2% |
| Dominicans | 0.0 /100 | #327 | Tragic 6.2% |
| Pueblo | 0.0 /100 | #328 | Tragic 6.2% |
| Alaska Natives | 0.0 /100 | #329 | Tragic 6.3% |
| Immigrants | Dominican Republic | 0.0 /100 | #330 | Tragic 6.3% |
| Tohono O'odham | 0.0 /100 | #331 | Tragic 6.3% |
| Pima | 0.0 /100 | #332 | Tragic 6.4% |
| Immigrants | Yemen | 0.0 /100 | #333 | Tragic 6.5% |
| Sioux | 0.0 /100 | #334 | Tragic 6.6% |
| Navajo | 0.0 /100 | #335 | Tragic 6.7% |
| Puerto Ricans | 0.0 /100 | #336 | Tragic 6.8% |
| Apache | 0.0 /100 | #337 | Tragic 7.0% |
| Colville | 0.0 /100 | #338 | Tragic 7.4% |
| Arapaho | 0.0 /100 | #339 | Tragic 7.5% |
| Hopi | 0.0 /100 | #340 | Tragic 7.5% |
| Paiute | 0.0 /100 | #341 | Tragic 7.8% |