Dominican vs Navajo Married-couple Households
COMPARE
Dominican
Navajo
Married-couple Households
Married-couple Households Comparison
Dominicans
Navajo
38.2%
MARRIED-COUPLE HOUSEHOLDS
0.0/ 100
METRIC RATING
340th/ 347
METRIC RANK
40.1%
MARRIED-COUPLE HOUSEHOLDS
0.0/ 100
METRIC RATING
324th/ 347
METRIC RANK
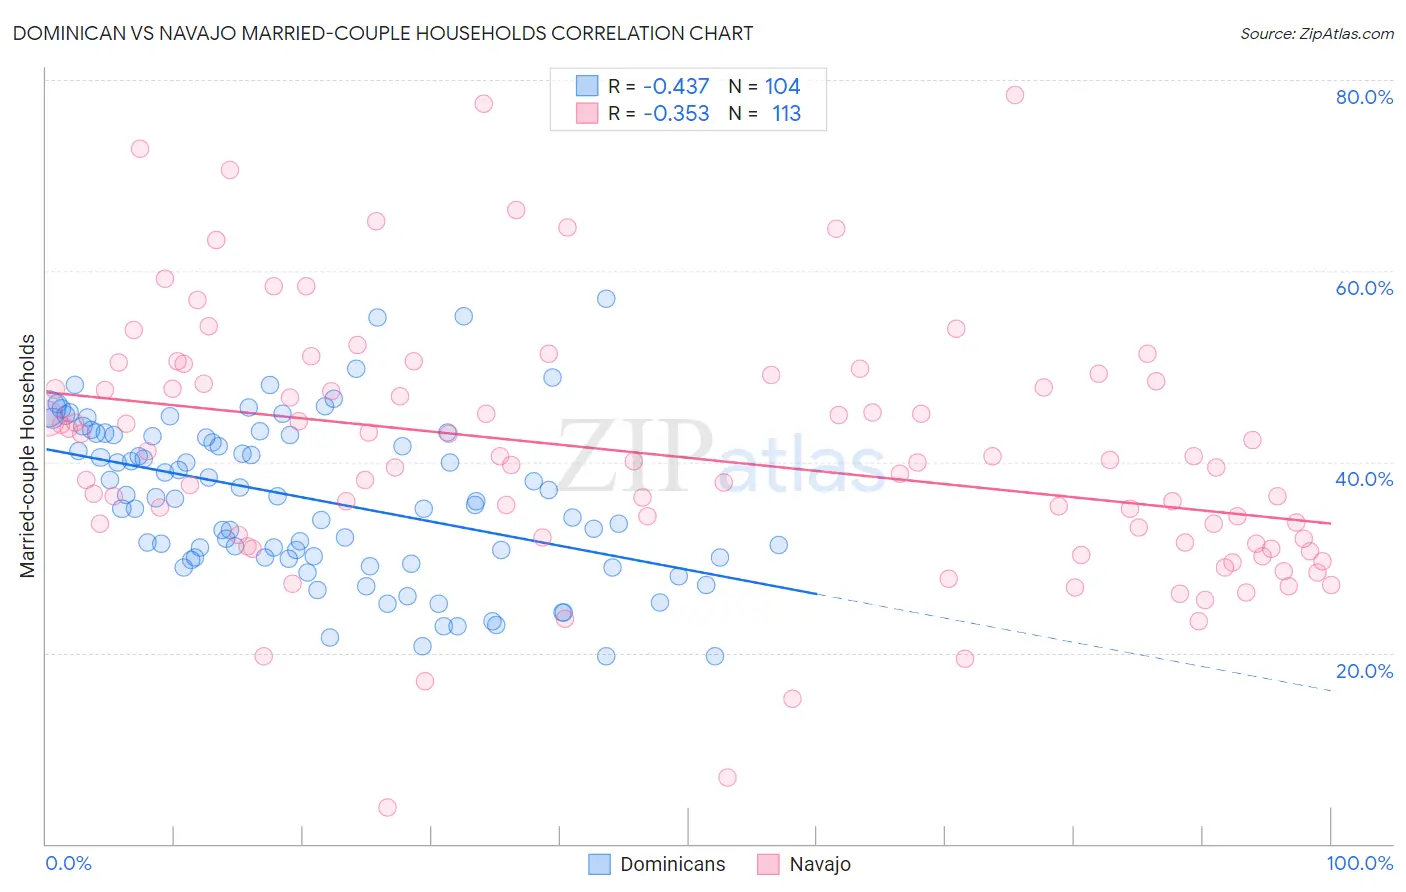
Dominican vs Navajo Married-couple Households Correlation Chart
The statistical analysis conducted on geographies consisting of 354,744,310 people shows a moderate negative correlation between the proportion of Dominicans and percentage of married-couple family households in the United States with a correlation coefficient (R) of -0.437 and weighted average of 38.2%. Similarly, the statistical analysis conducted on geographies consisting of 224,747,945 people shows a mild negative correlation between the proportion of Navajo and percentage of married-couple family households in the United States with a correlation coefficient (R) of -0.353 and weighted average of 40.1%, a difference of 4.9%.
Married-couple Households Correlation Summary
| Measurement | Dominican | Navajo |
| Minimum | 19.7% | 3.8% |
| Maximum | 57.1% | 78.4% |
| Range | 37.4% | 74.6% |
| Mean | 36.1% | 40.7% |
| Median | 36.2% | 39.9% |
| Interquartile 25% (IQ1) | 30.0% | 31.5% |
| Interquartile 75% (IQ3) | 42.8% | 48.3% |
| Interquartile Range (IQR) | 12.8% | 16.8% |
| Standard Deviation (Sample) | 8.3% | 13.4% |
| Standard Deviation (Population) | 8.3% | 13.3% |
Demographics Similar to Dominicans and Navajo by Married-couple Households
In terms of married-couple households, the demographic groups most similar to Dominicans are Cape Verdean (38.1%, a difference of 0.13%), British West Indian (38.3%, a difference of 0.38%), Immigrants from Senegal (38.4%, a difference of 0.50%), Immigrants from Somalia (38.4%, a difference of 0.66%), and Tohono O'odham (37.9%, a difference of 0.73%). Similarly, the demographic groups most similar to Navajo are Immigrants from Zaire (40.1%, a difference of 0.010%), Puerto Rican (40.1%, a difference of 0.010%), Pueblo (40.0%, a difference of 0.23%), U.S. Virgin Islander (39.8%, a difference of 0.69%), and Lumbee (39.6%, a difference of 1.2%).
| Demographics | Rating | Rank | Married-couple Households |
| Immigrants | Zaire | 0.0 /100 | #322 | Tragic 40.1% |
| Puerto Ricans | 0.0 /100 | #323 | Tragic 40.1% |
| Navajo | 0.0 /100 | #324 | Tragic 40.1% |
| Pueblo | 0.0 /100 | #325 | Tragic 40.0% |
| U.S. Virgin Islanders | 0.0 /100 | #326 | Tragic 39.8% |
| Lumbee | 0.0 /100 | #327 | Tragic 39.6% |
| Barbadians | 0.0 /100 | #328 | Tragic 39.4% |
| Immigrants | Dominica | 0.0 /100 | #329 | Tragic 39.4% |
| Immigrants | Barbados | 0.0 /100 | #330 | Tragic 39.2% |
| Immigrants | Congo | 0.0 /100 | #331 | Tragic 39.0% |
| Somalis | 0.0 /100 | #332 | Tragic 39.0% |
| Immigrants | West Indies | 0.0 /100 | #333 | Tragic 39.0% |
| Immigrants | St. Vincent and the Grenadines | 0.0 /100 | #334 | Tragic 38.7% |
| Senegalese | 0.0 /100 | #335 | Tragic 38.6% |
| Blacks/African Americans | 0.0 /100 | #336 | Tragic 38.5% |
| Immigrants | Somalia | 0.0 /100 | #337 | Tragic 38.4% |
| Immigrants | Senegal | 0.0 /100 | #338 | Tragic 38.4% |
| British West Indians | 0.0 /100 | #339 | Tragic 38.3% |
| Dominicans | 0.0 /100 | #340 | Tragic 38.2% |
| Cape Verdeans | 0.0 /100 | #341 | Tragic 38.1% |
| Tohono O'odham | 0.0 /100 | #342 | Tragic 37.9% |