Dominican vs Czechoslovakian 3 or more Vehicles in Household
COMPARE
Dominican
Czechoslovakian
3 or more Vehicles in Household
3 or more Vehicles in Household Comparison
Dominicans
Czechoslovakians
11.2%
3 OR MORE VEHICLES IN HOUSEHOLD
0.0/ 100
METRIC RATING
344th/ 347
METRIC RANK
21.7%
3 OR MORE VEHICLES IN HOUSEHOLD
99.8/ 100
METRIC RATING
78th/ 347
METRIC RANK
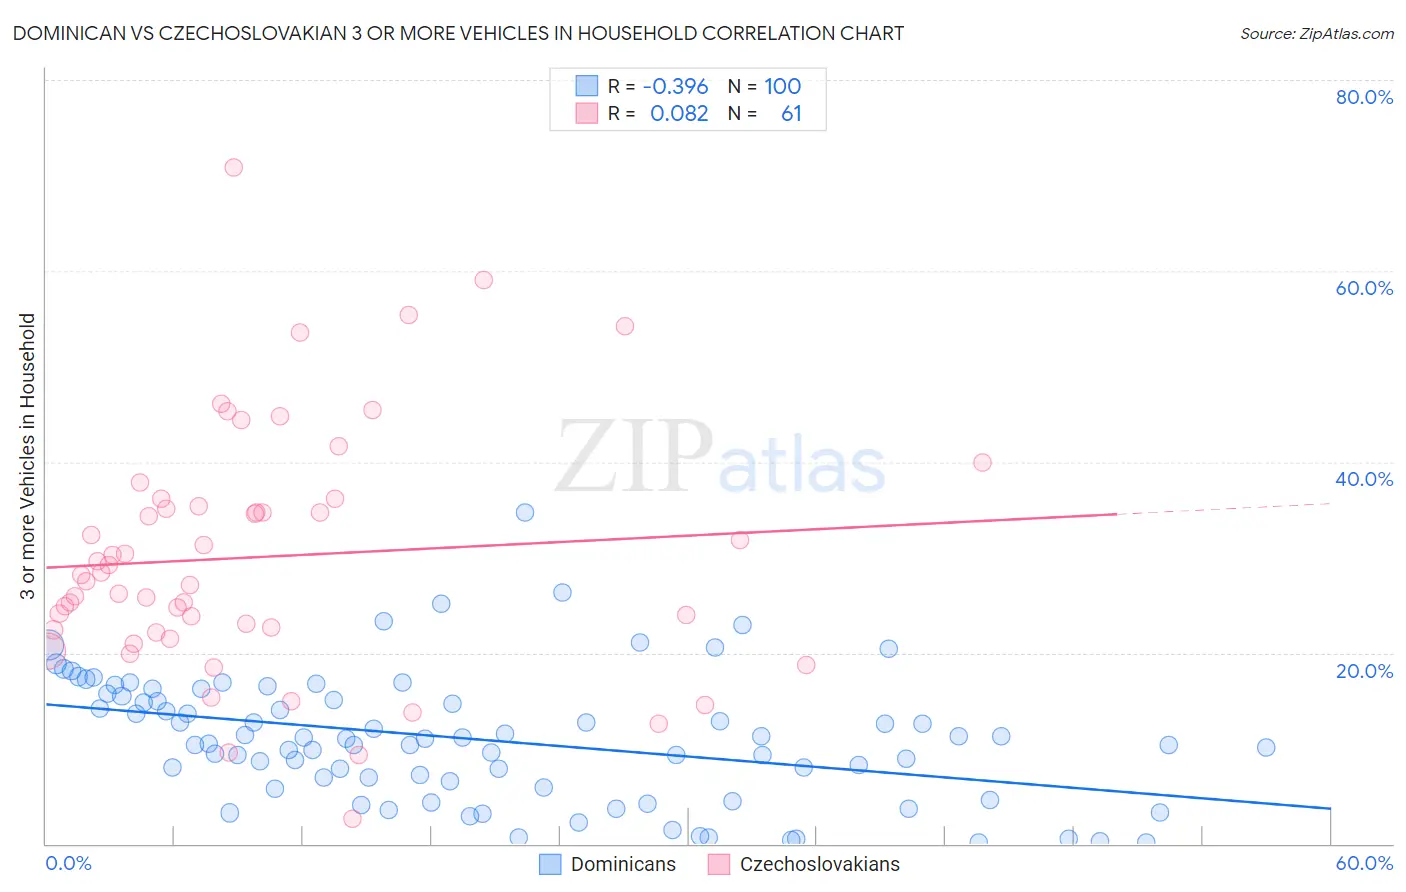
Dominican vs Czechoslovakian 3 or more Vehicles in Household Correlation Chart
The statistical analysis conducted on geographies consisting of 354,643,903 people shows a mild negative correlation between the proportion of Dominicans and percentage of households with 3 or more vehicles available in the United States with a correlation coefficient (R) of -0.396 and weighted average of 11.2%. Similarly, the statistical analysis conducted on geographies consisting of 368,488,312 people shows a slight positive correlation between the proportion of Czechoslovakians and percentage of households with 3 or more vehicles available in the United States with a correlation coefficient (R) of 0.082 and weighted average of 21.7%, a difference of 93.6%.
3 or more Vehicles in Household Correlation Summary
| Measurement | Dominican | Czechoslovakian |
| Minimum | 0.12% | 2.7% |
| Maximum | 34.8% | 70.8% |
| Range | 34.6% | 68.2% |
| Mean | 10.9% | 30.1% |
| Median | 10.7% | 28.2% |
| Interquartile 25% (IQ1) | 6.2% | 22.3% |
| Interquartile 75% (IQ3) | 15.3% | 35.8% |
| Interquartile Range (IQR) | 9.1% | 13.5% |
| Standard Deviation (Sample) | 6.7% | 12.9% |
| Standard Deviation (Population) | 6.6% | 12.8% |
Similar Demographics by 3 or more Vehicles in Household
Demographics Similar to Dominicans by 3 or more Vehicles in Household
In terms of 3 or more vehicles in household, the demographic groups most similar to Dominicans are Immigrants from Guyana (11.2%, a difference of 0.15%), British West Indian (11.4%, a difference of 2.0%), Guyanese (11.5%, a difference of 2.0%), Immigrants from Barbados (11.7%, a difference of 4.4%), and Immigrants from Uzbekistan (12.0%, a difference of 6.8%).
| Demographics | Rating | Rank | 3 or more Vehicles in Household |
| Immigrants | Cabo Verde | 0.0 /100 | #333 | Tragic 13.6% |
| Immigrants | Ecuador | 0.0 /100 | #334 | Tragic 13.4% |
| Immigrants | Trinidad and Tobago | 0.0 /100 | #335 | Tragic 13.3% |
| Barbadians | 0.0 /100 | #336 | Tragic 12.6% |
| Immigrants | Bangladesh | 0.0 /100 | #337 | Tragic 12.5% |
| Vietnamese | 0.0 /100 | #338 | Tragic 12.5% |
| Immigrants | Uzbekistan | 0.0 /100 | #339 | Tragic 12.0% |
| Immigrants | Barbados | 0.0 /100 | #340 | Tragic 11.7% |
| Guyanese | 0.0 /100 | #341 | Tragic 11.5% |
| British West Indians | 0.0 /100 | #342 | Tragic 11.4% |
| Immigrants | Guyana | 0.0 /100 | #343 | Tragic 11.2% |
| Dominicans | 0.0 /100 | #344 | Tragic 11.2% |
| Immigrants | Dominican Republic | 0.0 /100 | #345 | Tragic 10.4% |
| Immigrants | St. Vincent and the Grenadines | 0.0 /100 | #346 | Tragic 10.1% |
| Immigrants | Grenada | 0.0 /100 | #347 | Tragic 9.1% |
Demographics Similar to Czechoslovakians by 3 or more Vehicles in Household
In terms of 3 or more vehicles in household, the demographic groups most similar to Czechoslovakians are Assyrian/Chaldean/Syriac (21.7%, a difference of 0.0%), Irish (21.8%, a difference of 0.13%), Nonimmigrants (21.8%, a difference of 0.20%), Afghan (21.7%, a difference of 0.21%), and Japanese (21.8%, a difference of 0.25%).
| Demographics | Rating | Rank | 3 or more Vehicles in Household |
| Potawatomi | 99.8 /100 | #71 | Exceptional 21.9% |
| Portuguese | 99.8 /100 | #72 | Exceptional 21.8% |
| Salvadorans | 99.8 /100 | #73 | Exceptional 21.8% |
| Immigrants | Oceania | 99.8 /100 | #74 | Exceptional 21.8% |
| Japanese | 99.8 /100 | #75 | Exceptional 21.8% |
| Immigrants | Nonimmigrants | 99.8 /100 | #76 | Exceptional 21.8% |
| Irish | 99.8 /100 | #77 | Exceptional 21.8% |
| Czechoslovakians | 99.8 /100 | #78 | Exceptional 21.7% |
| Assyrians/Chaldeans/Syriacs | 99.8 /100 | #79 | Exceptional 21.7% |
| Afghans | 99.7 /100 | #80 | Exceptional 21.7% |
| Celtics | 99.7 /100 | #81 | Exceptional 21.7% |
| Immigrants | El Salvador | 99.6 /100 | #82 | Exceptional 21.5% |
| Chippewa | 99.6 /100 | #83 | Exceptional 21.5% |
| Icelanders | 99.6 /100 | #84 | Exceptional 21.5% |
| Laotians | 99.6 /100 | #85 | Exceptional 21.5% |