Arab vs Inupiat 4 or more Vehicles in Household
COMPARE
Arab
Inupiat
4 or more Vehicles in Household
4 or more Vehicles in Household Comparison
Arabs
Inupiat
6.0%
4 OR MORE VEHICLES IN HOUSEHOLD
14.4/ 100
METRIC RATING
213th/ 347
METRIC RANK
6.2%
4 OR MORE VEHICLES IN HOUSEHOLD
30.7/ 100
METRIC RATING
191st/ 347
METRIC RANK
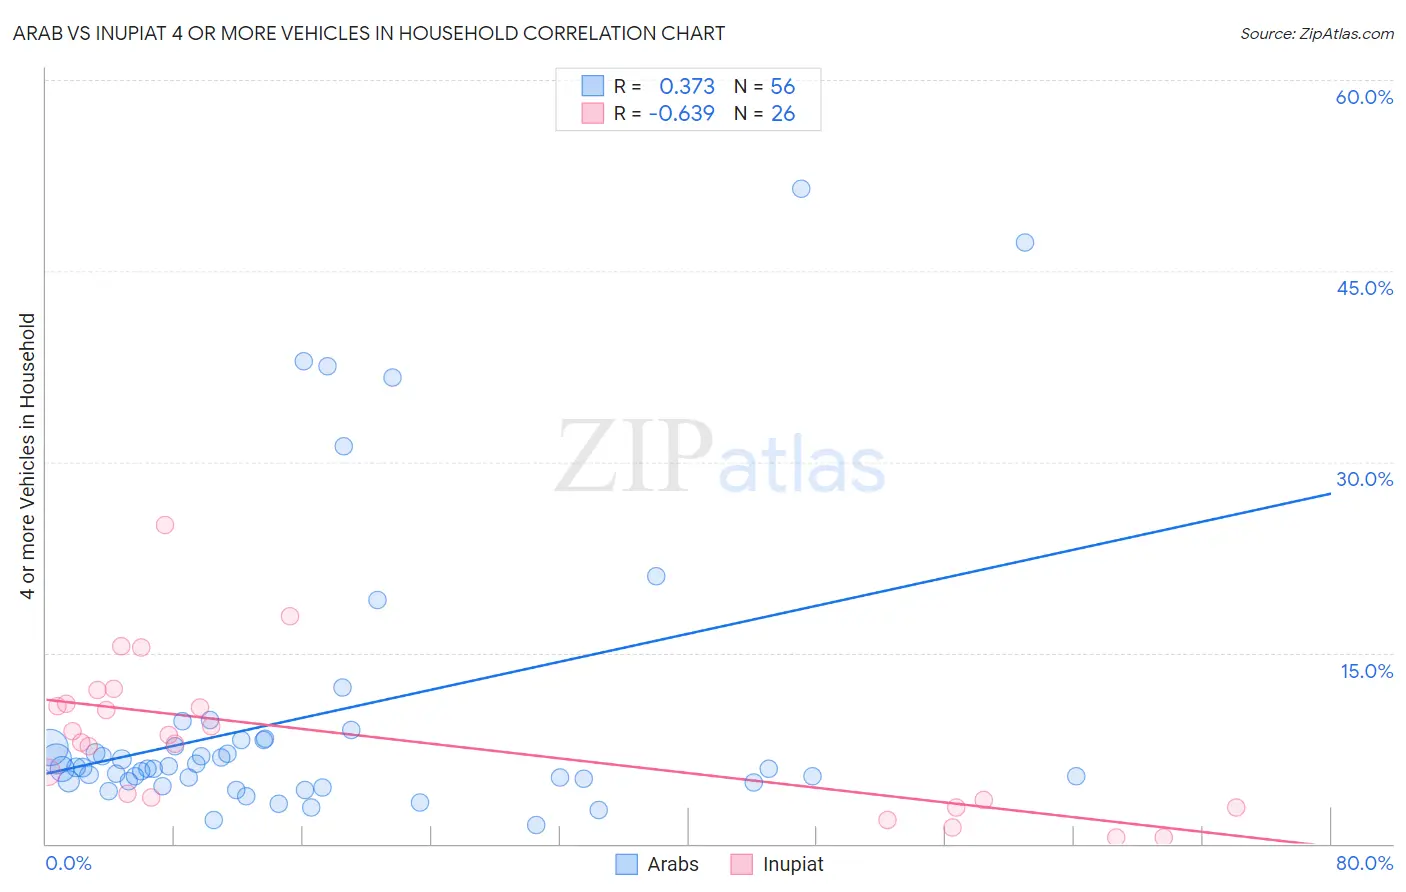
Arab vs Inupiat 4 or more Vehicles in Household Correlation Chart
The statistical analysis conducted on geographies consisting of 484,302,602 people shows a mild positive correlation between the proportion of Arabs and percentage of households with 4 or more vehicles available in the United States with a correlation coefficient (R) of 0.373 and weighted average of 6.0%. Similarly, the statistical analysis conducted on geographies consisting of 96,224,562 people shows a significant negative correlation between the proportion of Inupiat and percentage of households with 4 or more vehicles available in the United States with a correlation coefficient (R) of -0.639 and weighted average of 6.2%, a difference of 2.6%.
4 or more Vehicles in Household Correlation Summary
| Measurement | Arab | Inupiat |
| Minimum | 1.5% | 0.47% |
| Maximum | 51.4% | 25.0% |
| Range | 50.0% | 24.5% |
| Mean | 10.0% | 8.4% |
| Median | 5.9% | 8.3% |
| Interquartile 25% (IQ1) | 4.9% | 3.4% |
| Interquartile 75% (IQ3) | 8.1% | 11.0% |
| Interquartile Range (IQR) | 3.2% | 7.5% |
| Standard Deviation (Sample) | 11.3% | 5.9% |
| Standard Deviation (Population) | 11.2% | 5.8% |
Similar Demographics by 4 or more Vehicles in Household
Demographics Similar to Arabs by 4 or more Vehicles in Household
In terms of 4 or more vehicles in household, the demographic groups most similar to Arabs are Immigrants from Austria (6.0%, a difference of 0.020%), Immigrants from Egypt (6.0%, a difference of 0.060%), Panamanian (6.0%, a difference of 0.080%), Immigrants from China (6.0%, a difference of 0.13%), and Immigrants from Romania (6.0%, a difference of 0.13%).
| Demographics | Rating | Rank | 4 or more Vehicles in Household |
| Kenyans | 18.5 /100 | #206 | Poor 6.1% |
| Immigrants | Chile | 16.9 /100 | #207 | Poor 6.1% |
| Immigrants | Nigeria | 15.6 /100 | #208 | Poor 6.1% |
| Immigrants | Honduras | 15.4 /100 | #209 | Poor 6.1% |
| Immigrants | Zimbabwe | 15.1 /100 | #210 | Poor 6.0% |
| Panamanians | 14.8 /100 | #211 | Poor 6.0% |
| Immigrants | Egypt | 14.7 /100 | #212 | Poor 6.0% |
| Arabs | 14.4 /100 | #213 | Poor 6.0% |
| Immigrants | Austria | 14.3 /100 | #214 | Poor 6.0% |
| Immigrants | China | 13.8 /100 | #215 | Poor 6.0% |
| Immigrants | Romania | 13.8 /100 | #216 | Poor 6.0% |
| Nigerians | 12.2 /100 | #217 | Poor 6.0% |
| Immigrants | Italy | 11.0 /100 | #218 | Poor 6.0% |
| Serbians | 11.0 /100 | #219 | Poor 6.0% |
| Russians | 10.3 /100 | #220 | Poor 6.0% |
Demographics Similar to Inupiat by 4 or more Vehicles in Household
In terms of 4 or more vehicles in household, the demographic groups most similar to Inupiat are Romanian (6.2%, a difference of 0.010%), South African (6.2%, a difference of 0.18%), Immigrants from Eastern Asia (6.2%, a difference of 0.30%), Immigrants from Kuwait (6.2%, a difference of 0.35%), and Kiowa (6.2%, a difference of 0.47%).
| Demographics | Rating | Rank | 4 or more Vehicles in Household |
| Iraqis | 37.3 /100 | #184 | Fair 6.2% |
| Thais | 36.9 /100 | #185 | Fair 6.2% |
| Immigrants | Northern Europe | 36.8 /100 | #186 | Fair 6.2% |
| Immigrants | South Africa | 35.4 /100 | #187 | Fair 6.2% |
| Kiowa | 34.7 /100 | #188 | Fair 6.2% |
| Immigrants | Eastern Asia | 33.3 /100 | #189 | Fair 6.2% |
| South Africans | 32.2 /100 | #190 | Fair 6.2% |
| Inupiat | 30.7 /100 | #191 | Fair 6.2% |
| Romanians | 30.7 /100 | #192 | Fair 6.2% |
| Immigrants | Kuwait | 28.0 /100 | #193 | Fair 6.2% |
| Immigrants | Sweden | 27.0 /100 | #194 | Fair 6.2% |
| Argentineans | 27.0 /100 | #195 | Fair 6.2% |
| Tsimshian | 26.4 /100 | #196 | Fair 6.2% |
| Immigrants | Sri Lanka | 23.7 /100 | #197 | Fair 6.1% |
| Immigrants | Portugal | 22.3 /100 | #198 | Fair 6.1% |