Czechoslovakian vs Yup'ik 3 or more Vehicles in Household
COMPARE
Czechoslovakian
Yup'ik
3 or more Vehicles in Household
3 or more Vehicles in Household Comparison
Czechoslovakians
Yup'ik
21.7%
3 OR MORE VEHICLES IN HOUSEHOLD
99.8/ 100
METRIC RATING
78th/ 347
METRIC RANK
14.8%
3 OR MORE VEHICLES IN HOUSEHOLD
0.0/ 100
METRIC RATING
320th/ 347
METRIC RANK
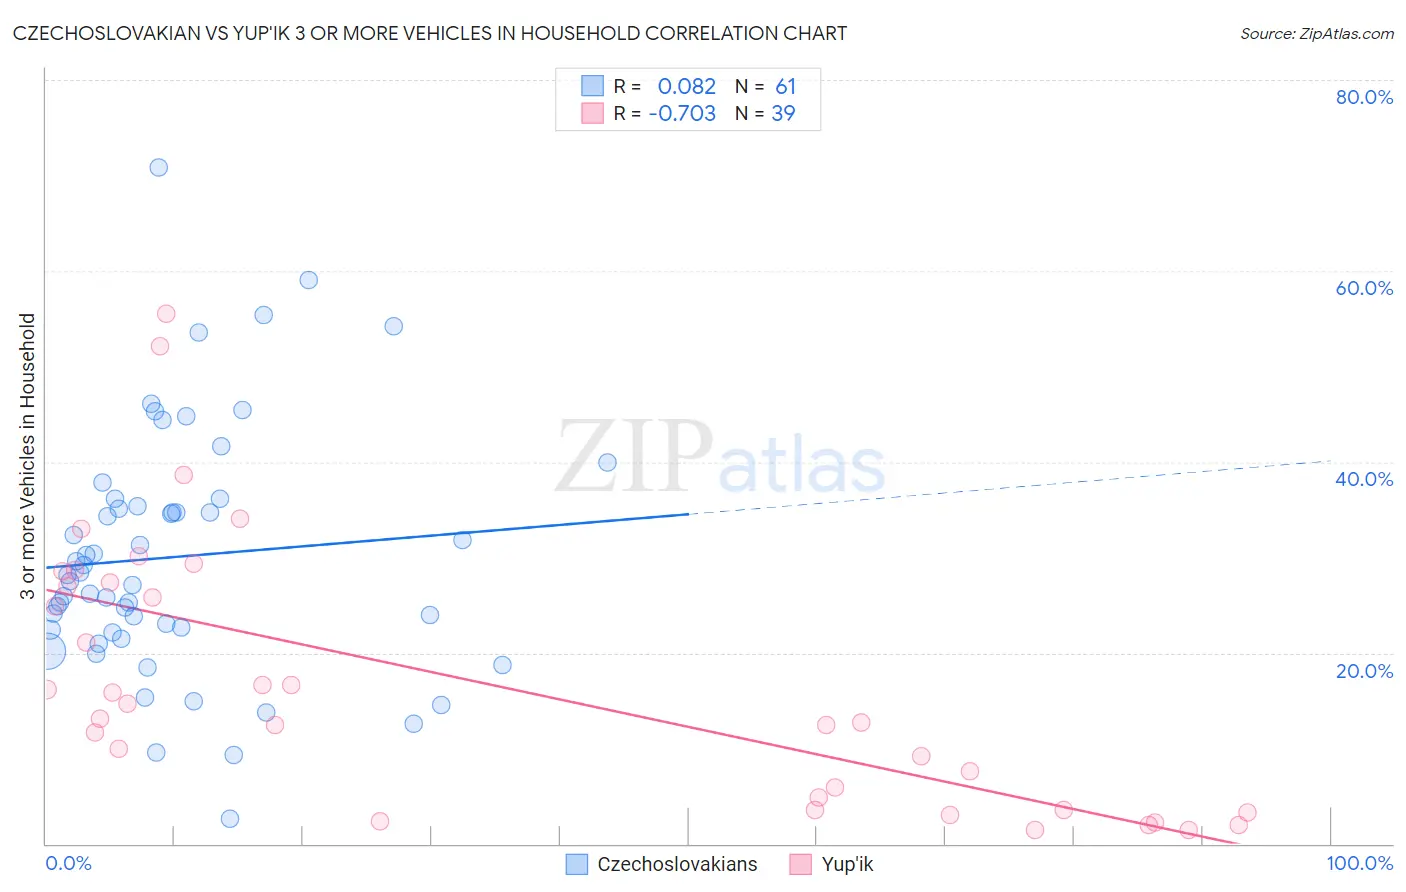
Czechoslovakian vs Yup'ik 3 or more Vehicles in Household Correlation Chart
The statistical analysis conducted on geographies consisting of 368,488,312 people shows a slight positive correlation between the proportion of Czechoslovakians and percentage of households with 3 or more vehicles available in the United States with a correlation coefficient (R) of 0.082 and weighted average of 21.7%. Similarly, the statistical analysis conducted on geographies consisting of 39,914,717 people shows a strong negative correlation between the proportion of Yup'ik and percentage of households with 3 or more vehicles available in the United States with a correlation coefficient (R) of -0.703 and weighted average of 14.8%, a difference of 46.5%.
3 or more Vehicles in Household Correlation Summary
| Measurement | Czechoslovakian | Yup'ik |
| Minimum | 2.7% | 1.4% |
| Maximum | 70.8% | 55.6% |
| Range | 68.2% | 54.1% |
| Mean | 30.1% | 16.9% |
| Median | 28.2% | 13.1% |
| Interquartile 25% (IQ1) | 22.3% | 3.6% |
| Interquartile 75% (IQ3) | 35.8% | 27.4% |
| Interquartile Range (IQR) | 13.5% | 23.9% |
| Standard Deviation (Sample) | 12.9% | 13.9% |
| Standard Deviation (Population) | 12.8% | 13.8% |
Similar Demographics by 3 or more Vehicles in Household
Demographics Similar to Czechoslovakians by 3 or more Vehicles in Household
In terms of 3 or more vehicles in household, the demographic groups most similar to Czechoslovakians are Assyrian/Chaldean/Syriac (21.7%, a difference of 0.0%), Irish (21.8%, a difference of 0.13%), Nonimmigrants (21.8%, a difference of 0.20%), Afghan (21.7%, a difference of 0.21%), and Japanese (21.8%, a difference of 0.25%).
| Demographics | Rating | Rank | 3 or more Vehicles in Household |
| Potawatomi | 99.8 /100 | #71 | Exceptional 21.9% |
| Portuguese | 99.8 /100 | #72 | Exceptional 21.8% |
| Salvadorans | 99.8 /100 | #73 | Exceptional 21.8% |
| Immigrants | Oceania | 99.8 /100 | #74 | Exceptional 21.8% |
| Japanese | 99.8 /100 | #75 | Exceptional 21.8% |
| Immigrants | Nonimmigrants | 99.8 /100 | #76 | Exceptional 21.8% |
| Irish | 99.8 /100 | #77 | Exceptional 21.8% |
| Czechoslovakians | 99.8 /100 | #78 | Exceptional 21.7% |
| Assyrians/Chaldeans/Syriacs | 99.8 /100 | #79 | Exceptional 21.7% |
| Afghans | 99.7 /100 | #80 | Exceptional 21.7% |
| Celtics | 99.7 /100 | #81 | Exceptional 21.7% |
| Immigrants | El Salvador | 99.6 /100 | #82 | Exceptional 21.5% |
| Chippewa | 99.6 /100 | #83 | Exceptional 21.5% |
| Icelanders | 99.6 /100 | #84 | Exceptional 21.5% |
| Laotians | 99.6 /100 | #85 | Exceptional 21.5% |
Demographics Similar to Yup'ik by 3 or more Vehicles in Household
In terms of 3 or more vehicles in household, the demographic groups most similar to Yup'ik are Cape Verdean (15.0%, a difference of 1.1%), Immigrants from Jamaica (14.7%, a difference of 1.1%), Immigrants from West Indies (14.6%, a difference of 1.4%), Immigrants from Caribbean (14.6%, a difference of 1.9%), and Immigrants from Haiti (15.2%, a difference of 2.3%).
| Demographics | Rating | Rank | 3 or more Vehicles in Household |
| Immigrants | Israel | 0.0 /100 | #313 | Tragic 15.6% |
| Immigrants | Belarus | 0.0 /100 | #314 | Tragic 15.5% |
| Haitians | 0.0 /100 | #315 | Tragic 15.5% |
| U.S. Virgin Islanders | 0.0 /100 | #316 | Tragic 15.4% |
| Jamaicans | 0.0 /100 | #317 | Tragic 15.2% |
| Immigrants | Haiti | 0.0 /100 | #318 | Tragic 15.2% |
| Cape Verdeans | 0.0 /100 | #319 | Tragic 15.0% |
| Yup'ik | 0.0 /100 | #320 | Tragic 14.8% |
| Immigrants | Jamaica | 0.0 /100 | #321 | Tragic 14.7% |
| Immigrants | West Indies | 0.0 /100 | #322 | Tragic 14.6% |
| Immigrants | Caribbean | 0.0 /100 | #323 | Tragic 14.6% |
| Immigrants | Yemen | 0.0 /100 | #324 | Tragic 14.2% |
| Senegalese | 0.0 /100 | #325 | Tragic 14.2% |
| Soviet Union | 0.0 /100 | #326 | Tragic 14.2% |
| Ecuadorians | 0.0 /100 | #327 | Tragic 14.1% |