Welsh vs Yup'ik 3 or more Vehicles in Household
COMPARE
Welsh
Yup'ik
3 or more Vehicles in Household
3 or more Vehicles in Household Comparison
Welsh
Yup'ik
22.6%
3 OR MORE VEHICLES IN HOUSEHOLD
100.0/ 100
METRIC RATING
52nd/ 347
METRIC RANK
14.8%
3 OR MORE VEHICLES IN HOUSEHOLD
0.0/ 100
METRIC RATING
320th/ 347
METRIC RANK
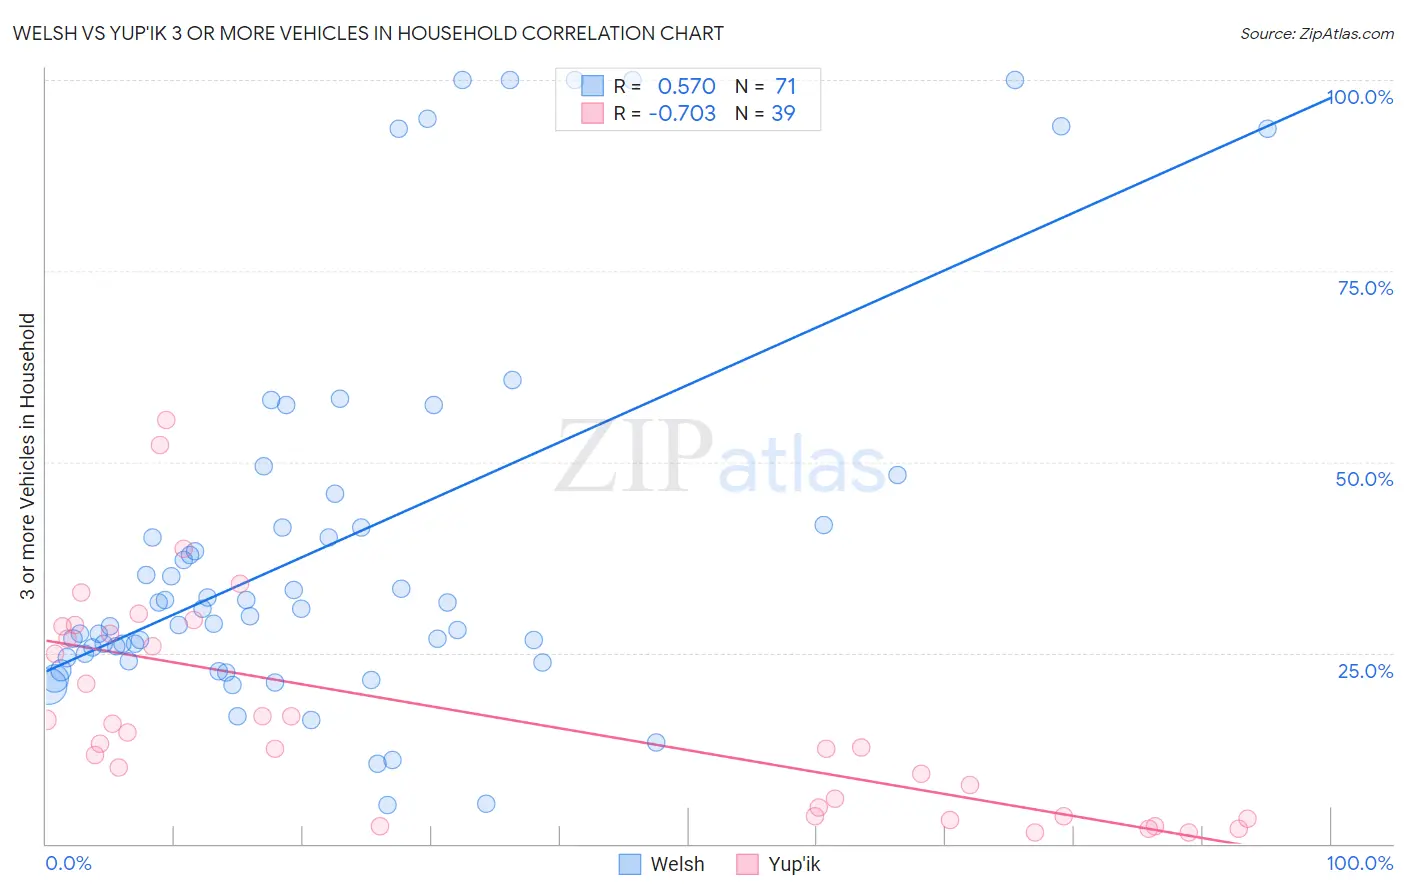
Welsh vs Yup'ik 3 or more Vehicles in Household Correlation Chart
The statistical analysis conducted on geographies consisting of 528,014,729 people shows a substantial positive correlation between the proportion of Welsh and percentage of households with 3 or more vehicles available in the United States with a correlation coefficient (R) of 0.570 and weighted average of 22.6%. Similarly, the statistical analysis conducted on geographies consisting of 39,914,717 people shows a strong negative correlation between the proportion of Yup'ik and percentage of households with 3 or more vehicles available in the United States with a correlation coefficient (R) of -0.703 and weighted average of 14.8%, a difference of 52.1%.
3 or more Vehicles in Household Correlation Summary
| Measurement | Welsh | Yup'ik |
| Minimum | 5.1% | 1.4% |
| Maximum | 100.0% | 55.6% |
| Range | 94.9% | 54.1% |
| Mean | 39.0% | 16.9% |
| Median | 30.7% | 13.1% |
| Interquartile 25% (IQ1) | 24.3% | 3.6% |
| Interquartile 75% (IQ3) | 41.7% | 27.4% |
| Interquartile Range (IQR) | 17.3% | 23.9% |
| Standard Deviation (Sample) | 25.2% | 13.9% |
| Standard Deviation (Population) | 25.0% | 13.8% |
Similar Demographics by 3 or more Vehicles in Household
Demographics Similar to Welsh by 3 or more Vehicles in Household
In terms of 3 or more vehicles in household, the demographic groups most similar to Welsh are White/Caucasian (22.6%, a difference of 0.040%), Sioux (22.6%, a difference of 0.050%), Scotch-Irish (22.6%, a difference of 0.11%), Scottish (22.6%, a difference of 0.21%), and Malaysian (22.6%, a difference of 0.22%).
| Demographics | Rating | Rank | 3 or more Vehicles in Household |
| Ute | 100.0 /100 | #45 | Exceptional 22.7% |
| Americans | 100.0 /100 | #46 | Exceptional 22.6% |
| Malaysians | 100.0 /100 | #47 | Exceptional 22.6% |
| Scottish | 100.0 /100 | #48 | Exceptional 22.6% |
| Scotch-Irish | 100.0 /100 | #49 | Exceptional 22.6% |
| Sioux | 100.0 /100 | #50 | Exceptional 22.6% |
| Whites/Caucasians | 100.0 /100 | #51 | Exceptional 22.6% |
| Welsh | 100.0 /100 | #52 | Exceptional 22.6% |
| Czechs | 100.0 /100 | #53 | Exceptional 22.5% |
| Crow | 100.0 /100 | #54 | Exceptional 22.5% |
| Immigrants | Laos | 100.0 /100 | #55 | Exceptional 22.4% |
| Hispanics or Latinos | 100.0 /100 | #56 | Exceptional 22.4% |
| Pennsylvania Germans | 100.0 /100 | #57 | Exceptional 22.3% |
| Spaniards | 100.0 /100 | #58 | Exceptional 22.3% |
| Navajo | 100.0 /100 | #59 | Exceptional 22.3% |
Demographics Similar to Yup'ik by 3 or more Vehicles in Household
In terms of 3 or more vehicles in household, the demographic groups most similar to Yup'ik are Cape Verdean (15.0%, a difference of 1.1%), Immigrants from Jamaica (14.7%, a difference of 1.1%), Immigrants from West Indies (14.6%, a difference of 1.4%), Immigrants from Caribbean (14.6%, a difference of 1.9%), and Immigrants from Haiti (15.2%, a difference of 2.3%).
| Demographics | Rating | Rank | 3 or more Vehicles in Household |
| Immigrants | Israel | 0.0 /100 | #313 | Tragic 15.6% |
| Immigrants | Belarus | 0.0 /100 | #314 | Tragic 15.5% |
| Haitians | 0.0 /100 | #315 | Tragic 15.5% |
| U.S. Virgin Islanders | 0.0 /100 | #316 | Tragic 15.4% |
| Jamaicans | 0.0 /100 | #317 | Tragic 15.2% |
| Immigrants | Haiti | 0.0 /100 | #318 | Tragic 15.2% |
| Cape Verdeans | 0.0 /100 | #319 | Tragic 15.0% |
| Yup'ik | 0.0 /100 | #320 | Tragic 14.8% |
| Immigrants | Jamaica | 0.0 /100 | #321 | Tragic 14.7% |
| Immigrants | West Indies | 0.0 /100 | #322 | Tragic 14.6% |
| Immigrants | Caribbean | 0.0 /100 | #323 | Tragic 14.6% |
| Immigrants | Yemen | 0.0 /100 | #324 | Tragic 14.2% |
| Senegalese | 0.0 /100 | #325 | Tragic 14.2% |
| Soviet Union | 0.0 /100 | #326 | Tragic 14.2% |
| Ecuadorians | 0.0 /100 | #327 | Tragic 14.1% |