Cypriot vs Immigrants from Chile Unemployment Among Women with Children Under 6 years
COMPARE
Cypriot
Immigrants from Chile
Unemployment Among Women with Children Under 6 years
Unemployment Among Women with Children Under 6 years Comparison
Cypriots
Immigrants from Chile
6.5%
UNEMPLOYMENT AMONG WOMEN WITH CHILDREN UNDER 6 YEARS
100.0/ 100
METRIC RATING
26th/ 347
METRIC RANK
7.3%
UNEMPLOYMENT AMONG WOMEN WITH CHILDREN UNDER 6 YEARS
93.5/ 100
METRIC RATING
121st/ 347
METRIC RANK
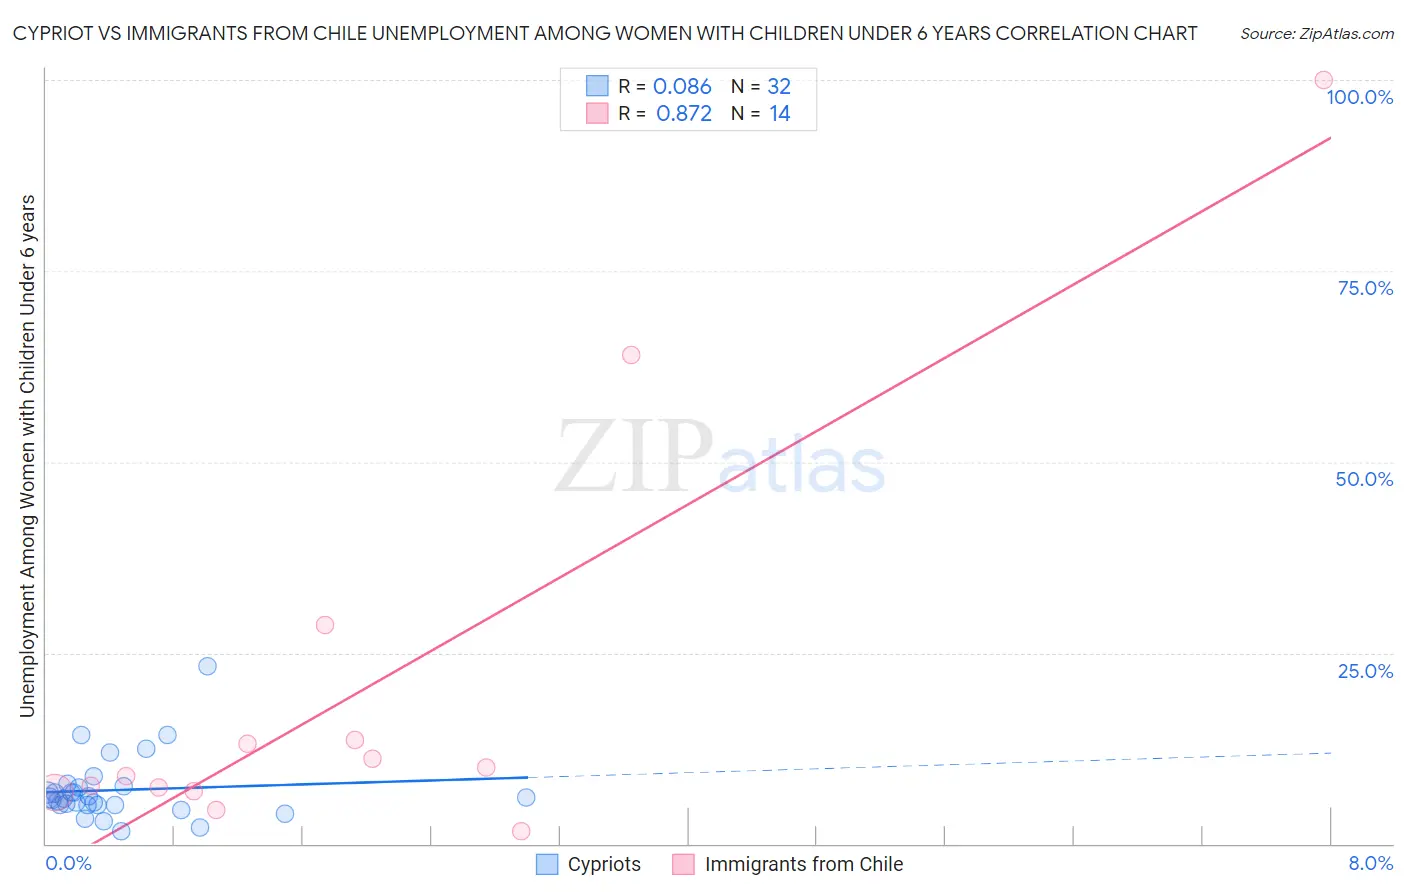
Cypriot vs Immigrants from Chile Unemployment Among Women with Children Under 6 years Correlation Chart
The statistical analysis conducted on geographies consisting of 55,986,412 people shows a slight positive correlation between the proportion of Cypriots and unemployment rate among women with children under the age of 6 in the United States with a correlation coefficient (R) of 0.086 and weighted average of 6.5%. Similarly, the statistical analysis conducted on geographies consisting of 184,982,304 people shows a very strong positive correlation between the proportion of Immigrants from Chile and unemployment rate among women with children under the age of 6 in the United States with a correlation coefficient (R) of 0.872 and weighted average of 7.3%, a difference of 11.8%.
Unemployment Among Women with Children Under 6 years Correlation Summary
| Measurement | Cypriot | Immigrants from Chile |
| Minimum | 1.6% | 1.6% |
| Maximum | 23.3% | 100.0% |
| Range | 21.7% | 98.4% |
| Mean | 7.0% | 20.3% |
| Median | 5.9% | 9.4% |
| Interquartile 25% (IQ1) | 5.1% | 6.9% |
| Interquartile 75% (IQ3) | 7.4% | 13.6% |
| Interquartile Range (IQR) | 2.4% | 6.7% |
| Standard Deviation (Sample) | 4.3% | 27.8% |
| Standard Deviation (Population) | 4.2% | 26.8% |
Similar Demographics by Unemployment Among Women with Children Under 6 years
Demographics Similar to Cypriots by Unemployment Among Women with Children Under 6 years
In terms of unemployment among women with children under 6 years, the demographic groups most similar to Cypriots are Soviet Union (6.5%, a difference of 0.080%), Laotian (6.5%, a difference of 0.10%), Immigrants from Japan (6.5%, a difference of 0.10%), Immigrants from Israel (6.5%, a difference of 0.12%), and Bulgarian (6.5%, a difference of 0.25%).
| Demographics | Rating | Rank | Unemployment Among Women with Children Under 6 years |
| Mongolians | 100.0 /100 | #19 | Exceptional 6.5% |
| Ute | 100.0 /100 | #20 | Exceptional 6.5% |
| Burmese | 100.0 /100 | #21 | Exceptional 6.5% |
| Immigrants | Korea | 100.0 /100 | #22 | Exceptional 6.5% |
| Bulgarians | 100.0 /100 | #23 | Exceptional 6.5% |
| Laotians | 100.0 /100 | #24 | Exceptional 6.5% |
| Soviet Union | 100.0 /100 | #25 | Exceptional 6.5% |
| Cypriots | 100.0 /100 | #26 | Exceptional 6.5% |
| Immigrants | Japan | 100.0 /100 | #27 | Exceptional 6.5% |
| Immigrants | Israel | 100.0 /100 | #28 | Exceptional 6.5% |
| Immigrants | Sweden | 100.0 /100 | #29 | Exceptional 6.6% |
| Immigrants | Belarus | 100.0 /100 | #30 | Exceptional 6.6% |
| Immigrants | Moldova | 100.0 /100 | #31 | Exceptional 6.6% |
| Tsimshian | 100.0 /100 | #32 | Exceptional 6.6% |
| Immigrants | Vietnam | 100.0 /100 | #33 | Exceptional 6.6% |
Demographics Similar to Immigrants from Chile by Unemployment Among Women with Children Under 6 years
In terms of unemployment among women with children under 6 years, the demographic groups most similar to Immigrants from Chile are Immigrants from Bosnia and Herzegovina (7.3%, a difference of 0.010%), Immigrants from Zaire (7.3%, a difference of 0.060%), Iraqi (7.3%, a difference of 0.12%), South African (7.3%, a difference of 0.19%), and Immigrants from South Africa (7.3%, a difference of 0.26%).
| Demographics | Rating | Rank | Unemployment Among Women with Children Under 6 years |
| Argentineans | 96.2 /100 | #114 | Exceptional 7.2% |
| Immigrants | Italy | 96.1 /100 | #115 | Exceptional 7.2% |
| Armenians | 95.9 /100 | #116 | Exceptional 7.2% |
| Immigrants | Kenya | 95.4 /100 | #117 | Exceptional 7.3% |
| Serbians | 94.5 /100 | #118 | Exceptional 7.3% |
| South Africans | 94.1 /100 | #119 | Exceptional 7.3% |
| Iraqis | 93.9 /100 | #120 | Exceptional 7.3% |
| Immigrants | Chile | 93.5 /100 | #121 | Exceptional 7.3% |
| Immigrants | Bosnia and Herzegovina | 93.5 /100 | #122 | Exceptional 7.3% |
| Immigrants | Zaire | 93.3 /100 | #123 | Exceptional 7.3% |
| Immigrants | South Africa | 92.5 /100 | #124 | Exceptional 7.3% |
| Pakistanis | 92.2 /100 | #125 | Exceptional 7.3% |
| Immigrants | Burma/Myanmar | 91.9 /100 | #126 | Exceptional 7.3% |
| Jordanians | 91.5 /100 | #127 | Exceptional 7.3% |
| Zimbabweans | 91.5 /100 | #128 | Exceptional 7.3% |