Cuban vs Immigrants from Jordan Professional Degree
COMPARE
Cuban
Immigrants from Jordan
Professional Degree
Professional Degree Comparison
Cubans
Immigrants from Jordan
4.0%
PROFESSIONAL DEGREE
5.9/ 100
METRIC RATING
227th/ 347
METRIC RANK
4.7%
PROFESSIONAL DEGREE
89.0/ 100
METRIC RATING
136th/ 347
METRIC RANK
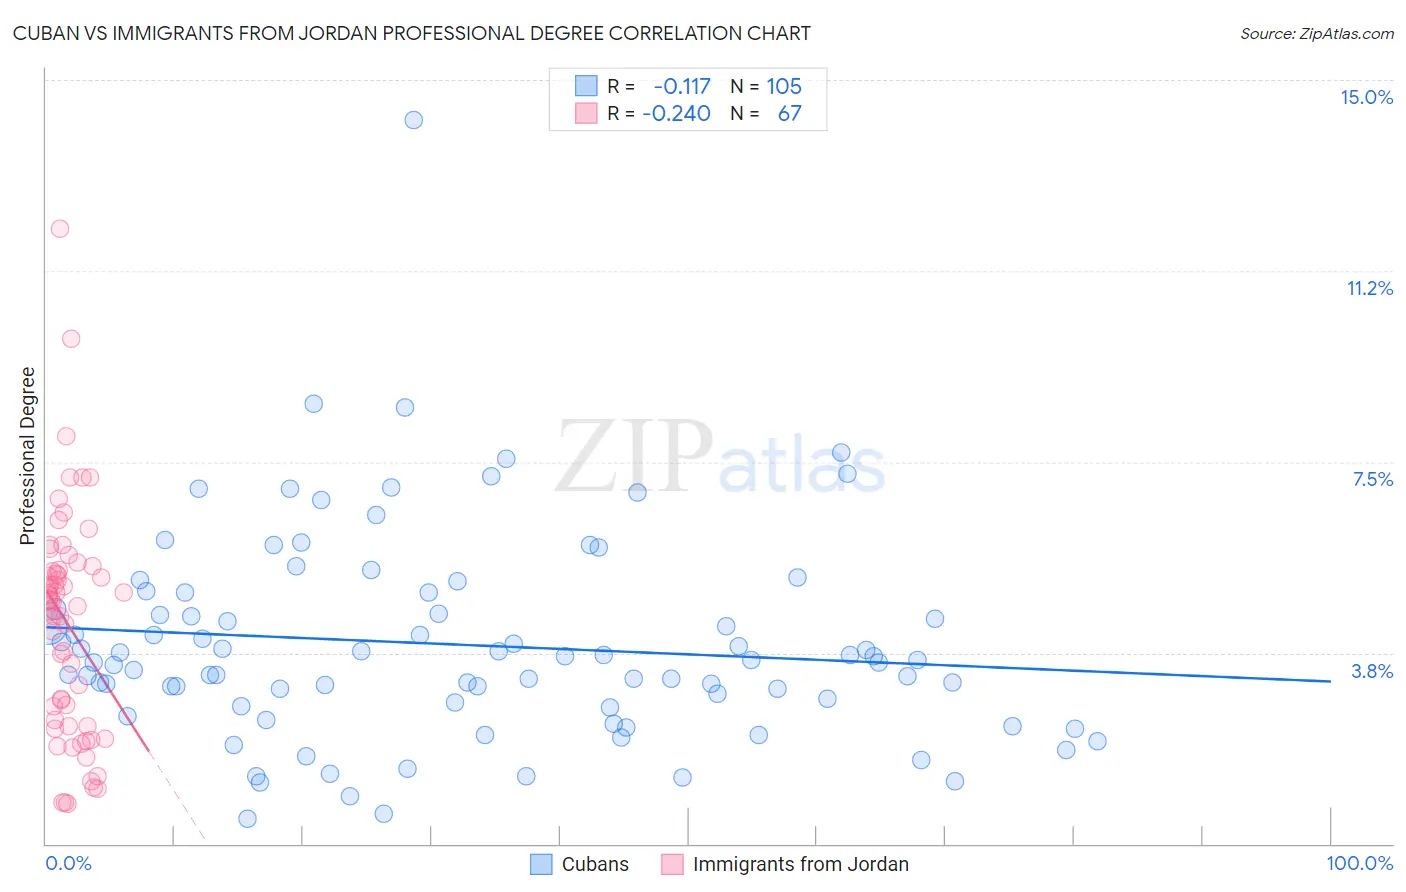
Cuban vs Immigrants from Jordan Professional Degree Correlation Chart
The statistical analysis conducted on geographies consisting of 447,765,815 people shows a poor negative correlation between the proportion of Cubans and percentage of population with at least professional degree education in the United States with a correlation coefficient (R) of -0.117 and weighted average of 4.0%. Similarly, the statistical analysis conducted on geographies consisting of 181,207,103 people shows a weak negative correlation between the proportion of Immigrants from Jordan and percentage of population with at least professional degree education in the United States with a correlation coefficient (R) of -0.240 and weighted average of 4.7%, a difference of 19.6%.
Professional Degree Correlation Summary
| Measurement | Cuban | Immigrants from Jordan |
| Minimum | 0.48% | 0.78% |
| Maximum | 14.2% | 12.1% |
| Range | 13.7% | 11.3% |
| Mean | 3.9% | 4.3% |
| Median | 3.6% | 4.7% |
| Interquartile 25% (IQ1) | 2.7% | 2.3% |
| Interquartile 75% (IQ3) | 4.8% | 5.4% |
| Interquartile Range (IQR) | 2.0% | 3.1% |
| Standard Deviation (Sample) | 2.0% | 2.2% |
| Standard Deviation (Population) | 2.0% | 2.2% |
Similar Demographics by Professional Degree
Demographics Similar to Cubans by Professional Degree
In terms of professional degree, the demographic groups most similar to Cubans are German Russian (4.0%, a difference of 0.12%), Immigrants from West Indies (4.0%, a difference of 0.25%), Immigrants from Burma/Myanmar (3.9%, a difference of 0.39%), Nicaraguan (3.9%, a difference of 0.67%), and Tlingit-Haida (4.0%, a difference of 0.68%).
| Demographics | Rating | Rank | Professional Degree |
| Ute | 8.2 /100 | #220 | Tragic 4.0% |
| French Canadians | 8.0 /100 | #221 | Tragic 4.0% |
| Immigrants | Western Africa | 7.5 /100 | #222 | Tragic 4.0% |
| Immigrants | Bosnia and Herzegovina | 7.4 /100 | #223 | Tragic 4.0% |
| Trinidadians and Tobagonians | 7.1 /100 | #224 | Tragic 4.0% |
| Tlingit-Haida | 6.9 /100 | #225 | Tragic 4.0% |
| German Russians | 6.1 /100 | #226 | Tragic 4.0% |
| Cubans | 5.9 /100 | #227 | Tragic 4.0% |
| Immigrants | West Indies | 5.6 /100 | #228 | Tragic 4.0% |
| Immigrants | Burma/Myanmar | 5.4 /100 | #229 | Tragic 3.9% |
| Nicaraguans | 5.1 /100 | #230 | Tragic 3.9% |
| Ecuadorians | 4.6 /100 | #231 | Tragic 3.9% |
| Cree | 4.3 /100 | #232 | Tragic 3.9% |
| Immigrants | Philippines | 4.1 /100 | #233 | Tragic 3.9% |
| Immigrants | Nonimmigrants | 4.0 /100 | #234 | Tragic 3.9% |
Demographics Similar to Immigrants from Jordan by Professional Degree
In terms of professional degree, the demographic groups most similar to Immigrants from Jordan are Jordanian (4.7%, a difference of 0.020%), Afghan (4.7%, a difference of 0.060%), Macedonian (4.8%, a difference of 0.28%), South American Indian (4.8%, a difference of 0.31%), and Italian (4.8%, a difference of 0.44%).
| Demographics | Rating | Rank | Professional Degree |
| Palestinians | 91.5 /100 | #129 | Exceptional 4.8% |
| Icelanders | 91.5 /100 | #130 | Exceptional 4.8% |
| Immigrants | Nepal | 91.4 /100 | #131 | Exceptional 4.8% |
| Pakistanis | 90.9 /100 | #132 | Exceptional 4.8% |
| Italians | 90.2 /100 | #133 | Exceptional 4.8% |
| South American Indians | 89.9 /100 | #134 | Excellent 4.8% |
| Macedonians | 89.8 /100 | #135 | Excellent 4.8% |
| Immigrants | Jordan | 89.0 /100 | #136 | Excellent 4.7% |
| Jordanians | 88.9 /100 | #137 | Excellent 4.7% |
| Afghans | 88.8 /100 | #138 | Excellent 4.7% |
| South Americans | 85.6 /100 | #139 | Excellent 4.7% |
| Canadians | 84.4 /100 | #140 | Excellent 4.7% |
| Basques | 81.8 /100 | #141 | Excellent 4.6% |
| Sudanese | 81.3 /100 | #142 | Excellent 4.6% |
| Hungarians | 80.8 /100 | #143 | Excellent 4.6% |