Cree vs Panamanian 4 or more Vehicles in Household
COMPARE
Cree
Panamanian
4 or more Vehicles in Household
4 or more Vehicles in Household Comparison
Cree
Panamanians
7.2%
4 OR MORE VEHICLES IN HOUSEHOLD
99.7/ 100
METRIC RATING
85th/ 347
METRIC RANK
6.0%
4 OR MORE VEHICLES IN HOUSEHOLD
14.8/ 100
METRIC RATING
211th/ 347
METRIC RANK
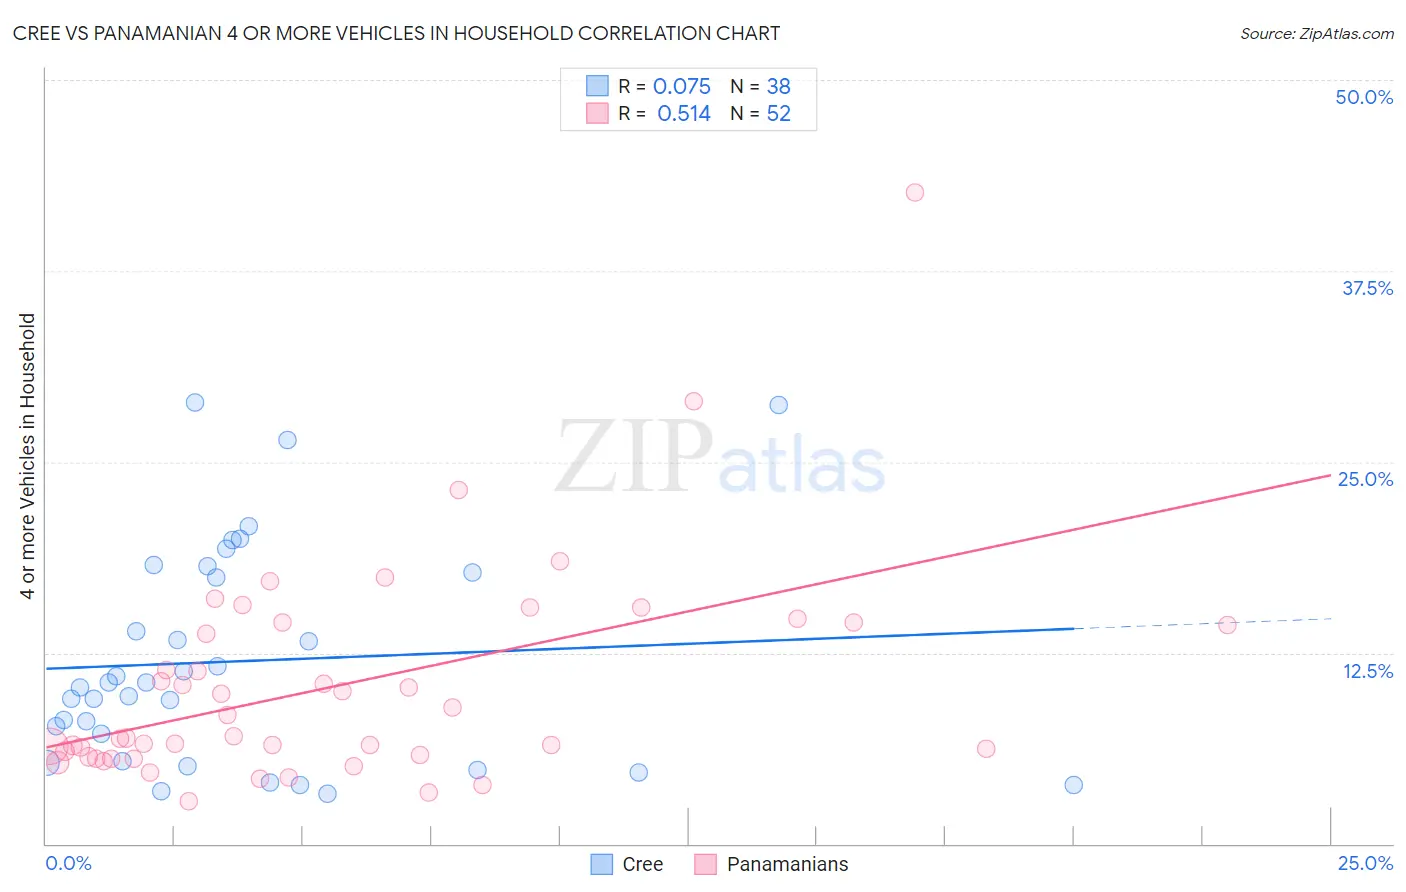
Cree vs Panamanian 4 or more Vehicles in Household Correlation Chart
The statistical analysis conducted on geographies consisting of 76,129,414 people shows a slight positive correlation between the proportion of Cree and percentage of households with 4 or more vehicles available in the United States with a correlation coefficient (R) of 0.075 and weighted average of 7.2%. Similarly, the statistical analysis conducted on geographies consisting of 279,879,359 people shows a substantial positive correlation between the proportion of Panamanians and percentage of households with 4 or more vehicles available in the United States with a correlation coefficient (R) of 0.514 and weighted average of 6.0%, a difference of 19.8%.
4 or more Vehicles in Household Correlation Summary
| Measurement | Cree | Panamanian |
| Minimum | 3.3% | 2.8% |
| Maximum | 28.9% | 42.6% |
| Range | 25.5% | 39.9% |
| Mean | 11.9% | 10.3% |
| Median | 10.4% | 7.0% |
| Interquartile 25% (IQ1) | 5.4% | 5.7% |
| Interquartile 75% (IQ3) | 17.7% | 14.4% |
| Interquartile Range (IQR) | 12.3% | 8.7% |
| Standard Deviation (Sample) | 7.1% | 7.1% |
| Standard Deviation (Population) | 7.0% | 7.0% |
Similar Demographics by 4 or more Vehicles in Household
Demographics Similar to Cree by 4 or more Vehicles in Household
In terms of 4 or more vehicles in household, the demographic groups most similar to Cree are Afghan (7.3%, a difference of 0.17%), Immigrants from Indonesia (7.2%, a difference of 0.18%), Delaware (7.2%, a difference of 0.24%), Nonimmigrants (7.2%, a difference of 0.26%), and Potawatomi (7.3%, a difference of 0.49%).
| Demographics | Rating | Rank | 4 or more Vehicles in Household |
| Whites/Caucasians | 99.8 /100 | #78 | Exceptional 7.4% |
| Czechs | 99.8 /100 | #79 | Exceptional 7.4% |
| Alaska Natives | 99.8 /100 | #80 | Exceptional 7.3% |
| Finns | 99.8 /100 | #81 | Exceptional 7.3% |
| Northern Europeans | 99.8 /100 | #82 | Exceptional 7.3% |
| Potawatomi | 99.7 /100 | #83 | Exceptional 7.3% |
| Afghans | 99.7 /100 | #84 | Exceptional 7.3% |
| Cree | 99.7 /100 | #85 | Exceptional 7.2% |
| Immigrants | Indonesia | 99.6 /100 | #86 | Exceptional 7.2% |
| Delaware | 99.6 /100 | #87 | Exceptional 7.2% |
| Immigrants | Nonimmigrants | 99.6 /100 | #88 | Exceptional 7.2% |
| British | 99.6 /100 | #89 | Exceptional 7.2% |
| Creek | 99.6 /100 | #90 | Exceptional 7.2% |
| Assyrians/Chaldeans/Syriacs | 99.4 /100 | #91 | Exceptional 7.2% |
| Immigrants | Latin America | 99.4 /100 | #92 | Exceptional 7.1% |
Demographics Similar to Panamanians by 4 or more Vehicles in Household
In terms of 4 or more vehicles in household, the demographic groups most similar to Panamanians are Immigrants from Egypt (6.0%, a difference of 0.020%), Immigrants from Zimbabwe (6.0%, a difference of 0.080%), Arab (6.0%, a difference of 0.080%), Immigrants from Austria (6.0%, a difference of 0.090%), and Immigrants from Honduras (6.1%, a difference of 0.13%).
| Demographics | Rating | Rank | 4 or more Vehicles in Household |
| Immigrants | Belize | 19.8 /100 | #204 | Poor 6.1% |
| Hondurans | 19.3 /100 | #205 | Poor 6.1% |
| Kenyans | 18.5 /100 | #206 | Poor 6.1% |
| Immigrants | Chile | 16.9 /100 | #207 | Poor 6.1% |
| Immigrants | Nigeria | 15.6 /100 | #208 | Poor 6.1% |
| Immigrants | Honduras | 15.4 /100 | #209 | Poor 6.1% |
| Immigrants | Zimbabwe | 15.1 /100 | #210 | Poor 6.0% |
| Panamanians | 14.8 /100 | #211 | Poor 6.0% |
| Immigrants | Egypt | 14.7 /100 | #212 | Poor 6.0% |
| Arabs | 14.4 /100 | #213 | Poor 6.0% |
| Immigrants | Austria | 14.3 /100 | #214 | Poor 6.0% |
| Immigrants | China | 13.8 /100 | #215 | Poor 6.0% |
| Immigrants | Romania | 13.8 /100 | #216 | Poor 6.0% |
| Nigerians | 12.2 /100 | #217 | Poor 6.0% |
| Immigrants | Italy | 11.0 /100 | #218 | Poor 6.0% |