Cree vs Panamanian Unemployment Among Women with Children Under 6 years
COMPARE
Cree
Panamanian
Unemployment Among Women with Children Under 6 years
Unemployment Among Women with Children Under 6 years Comparison
Cree
Panamanians
7.6%
UNEMPLOYMENT AMONG WOMEN WITH CHILDREN UNDER 6 YEARS
51.6/ 100
METRIC RATING
173rd/ 347
METRIC RANK
7.6%
UNEMPLOYMENT AMONG WOMEN WITH CHILDREN UNDER 6 YEARS
49.6/ 100
METRIC RATING
175th/ 347
METRIC RANK
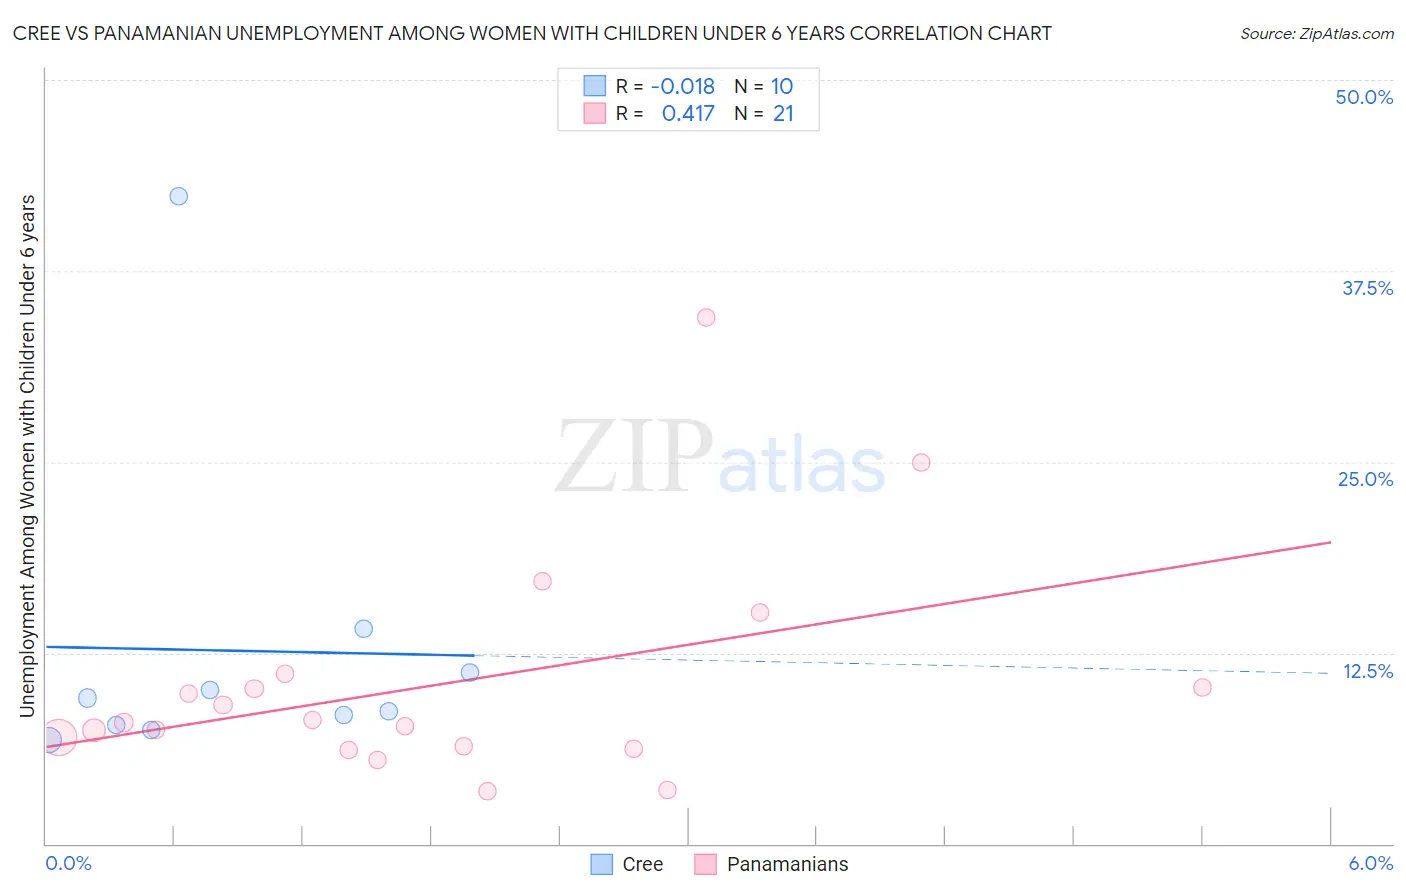
Cree vs Panamanian Unemployment Among Women with Children Under 6 years Correlation Chart
The statistical analysis conducted on geographies consisting of 69,437,717 people shows no correlation between the proportion of Cree and unemployment rate among women with children under the age of 6 in the United States with a correlation coefficient (R) of -0.018 and weighted average of 7.6%. Similarly, the statistical analysis conducted on geographies consisting of 233,067,196 people shows a moderate positive correlation between the proportion of Panamanians and unemployment rate among women with children under the age of 6 in the United States with a correlation coefficient (R) of 0.417 and weighted average of 7.6%, a difference of 0.13%.
Unemployment Among Women with Children Under 6 years Correlation Summary
| Measurement | Cree | Panamanian |
| Minimum | 6.8% | 3.4% |
| Maximum | 42.4% | 34.5% |
| Range | 35.6% | 31.0% |
| Mean | 12.6% | 10.4% |
| Median | 9.1% | 7.9% |
| Interquartile 25% (IQ1) | 7.8% | 6.3% |
| Interquartile 75% (IQ3) | 11.2% | 10.7% |
| Interquartile Range (IQR) | 3.4% | 4.4% |
| Standard Deviation (Sample) | 10.7% | 7.4% |
| Standard Deviation (Population) | 10.1% | 7.2% |
Demographics Similar to Cree and Panamanians by Unemployment Among Women with Children Under 6 years
In terms of unemployment among women with children under 6 years, the demographic groups most similar to Cree are Immigrants from Laos (7.6%, a difference of 0.11%), Puget Sound Salish (7.7%, a difference of 0.26%), Austrian (7.7%, a difference of 0.37%), Immigrants from North America (7.6%, a difference of 0.41%), and Immigrants from England (7.7%, a difference of 0.42%). Similarly, the demographic groups most similar to Panamanians are Immigrants from Laos (7.6%, a difference of 0.020%), Puget Sound Salish (7.7%, a difference of 0.13%), Austrian (7.7%, a difference of 0.24%), Immigrants from England (7.7%, a difference of 0.28%), and Immigrants from Western Europe (7.7%, a difference of 0.32%).
| Demographics | Rating | Rank | Unemployment Among Women with Children Under 6 years |
| Ugandans | 65.8 /100 | #164 | Good 7.6% |
| Immigrants | South America | 65.6 /100 | #165 | Good 7.6% |
| Belgians | 63.5 /100 | #166 | Good 7.6% |
| Kenyans | 62.5 /100 | #167 | Good 7.6% |
| Immigrants | Canada | 61.6 /100 | #168 | Good 7.6% |
| Immigrants | Scotland | 61.3 /100 | #169 | Good 7.6% |
| Czechs | 59.8 /100 | #170 | Average 7.6% |
| Immigrants | Grenada | 59.0 /100 | #171 | Average 7.6% |
| Immigrants | North America | 57.7 /100 | #172 | Average 7.6% |
| Cree | 51.6 /100 | #173 | Average 7.6% |
| Immigrants | Laos | 50.0 /100 | #174 | Average 7.6% |
| Panamanians | 49.6 /100 | #175 | Average 7.6% |
| Puget Sound Salish | 47.7 /100 | #176 | Average 7.7% |
| Austrians | 46.0 /100 | #177 | Average 7.7% |
| Immigrants | England | 45.4 /100 | #178 | Average 7.7% |
| Immigrants | Western Europe | 44.9 /100 | #179 | Average 7.7% |
| Immigrants | Uruguay | 44.5 /100 | #180 | Average 7.7% |
| Brazilians | 43.9 /100 | #181 | Average 7.7% |
| Nepalese | 43.5 /100 | #182 | Average 7.7% |
| Sierra Leoneans | 42.9 /100 | #183 | Average 7.7% |
| Indonesians | 40.5 /100 | #184 | Average 7.7% |