Comanche vs Immigrants from Brazil 1 or more Vehicles in Household
COMPARE
Comanche
Immigrants from Brazil
1 or more Vehicles in Household
1 or more Vehicles in Household Comparison
Comanche
Immigrants from Brazil
89.9%
1 OR MORE VEHICLES IN HOUSEHOLD
63.4/ 100
METRIC RATING
164th/ 347
METRIC RANK
89.6%
1 OR MORE VEHICLES IN HOUSEHOLD
40.1/ 100
METRIC RATING
185th/ 347
METRIC RANK
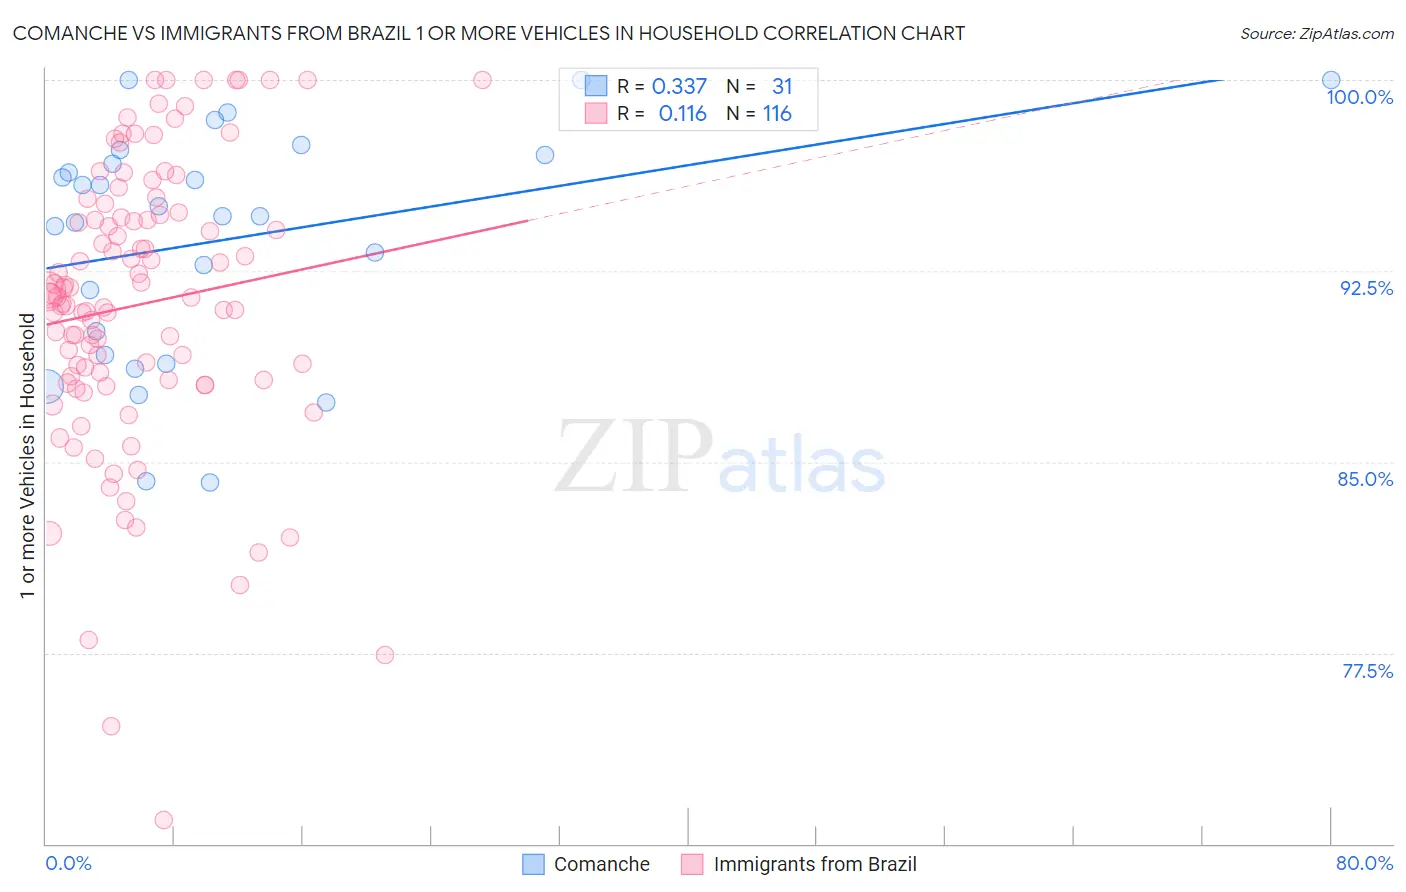
Comanche vs Immigrants from Brazil 1 or more Vehicles in Household Correlation Chart
The statistical analysis conducted on geographies consisting of 109,768,112 people shows a mild positive correlation between the proportion of Comanche and percentage of households with 1 or more vehicles available in the United States with a correlation coefficient (R) of 0.337 and weighted average of 89.9%. Similarly, the statistical analysis conducted on geographies consisting of 342,498,313 people shows a poor positive correlation between the proportion of Immigrants from Brazil and percentage of households with 1 or more vehicles available in the United States with a correlation coefficient (R) of 0.116 and weighted average of 89.6%, a difference of 0.37%.
1 or more Vehicles in Household Correlation Summary
| Measurement | Comanche | Immigrants from Brazil |
| Minimum | 84.2% | 70.9% |
| Maximum | 100.0% | 100.0% |
| Range | 15.8% | 29.1% |
| Mean | 93.7% | 91.2% |
| Median | 94.7% | 91.5% |
| Interquartile 25% (IQ1) | 89.2% | 88.2% |
| Interquartile 75% (IQ3) | 97.1% | 94.7% |
| Interquartile Range (IQR) | 7.9% | 6.4% |
| Standard Deviation (Sample) | 4.6% | 5.6% |
| Standard Deviation (Population) | 4.5% | 5.6% |
Similar Demographics by 1 or more Vehicles in Household
Demographics Similar to Comanche by 1 or more Vehicles in Household
In terms of 1 or more vehicles in household, the demographic groups most similar to Comanche are Immigrants from Saudi Arabia (89.9%, a difference of 0.010%), Immigrants from Middle Africa (89.9%, a difference of 0.020%), Immigrants from Austria (89.9%, a difference of 0.040%), Immigrants from Latin America (89.8%, a difference of 0.050%), and Immigrants from Cambodia (89.8%, a difference of 0.050%).
| Demographics | Rating | Rank | 1 or more Vehicles in Household |
| Immigrants | Congo | 71.2 /100 | #157 | Good 90.0% |
| Brazilians | 71.0 /100 | #158 | Good 90.0% |
| South Africans | 69.7 /100 | #159 | Good 90.0% |
| Immigrants | Indonesia | 68.8 /100 | #160 | Good 90.0% |
| Salvadorans | 68.7 /100 | #161 | Good 90.0% |
| Spanish American Indians | 67.0 /100 | #162 | Good 89.9% |
| Immigrants | Austria | 65.5 /100 | #163 | Good 89.9% |
| Comanche | 63.4 /100 | #164 | Good 89.9% |
| Immigrants | Saudi Arabia | 62.6 /100 | #165 | Good 89.9% |
| Immigrants | Middle Africa | 62.2 /100 | #166 | Good 89.9% |
| Immigrants | Latin America | 60.3 /100 | #167 | Good 89.8% |
| Immigrants | Cambodia | 60.1 /100 | #168 | Good 89.8% |
| Natives/Alaskans | 59.5 /100 | #169 | Average 89.8% |
| Immigrants | Costa Rica | 57.6 /100 | #170 | Average 89.8% |
| French American Indians | 54.4 /100 | #171 | Average 89.8% |
Demographics Similar to Immigrants from Brazil by 1 or more Vehicles in Household
In terms of 1 or more vehicles in household, the demographic groups most similar to Immigrants from Brazil are Pueblo (89.6%, a difference of 0.0%), Immigrants from Bulgaria (89.6%, a difference of 0.010%), South American (89.5%, a difference of 0.010%), Ethiopian (89.6%, a difference of 0.020%), and Immigrants from Nepal (89.5%, a difference of 0.020%).
| Demographics | Rating | Rank | 1 or more Vehicles in Household |
| Immigrants | El Salvador | 44.1 /100 | #178 | Average 89.6% |
| German Russians | 44.0 /100 | #179 | Average 89.6% |
| Arabs | 43.3 /100 | #180 | Average 89.6% |
| Immigrants | Ethiopia | 42.5 /100 | #181 | Average 89.6% |
| Ukrainians | 42.4 /100 | #182 | Average 89.6% |
| Ethiopians | 41.2 /100 | #183 | Average 89.6% |
| Immigrants | Bulgaria | 40.7 /100 | #184 | Average 89.6% |
| Immigrants | Brazil | 40.1 /100 | #185 | Average 89.6% |
| Pueblo | 39.9 /100 | #186 | Fair 89.6% |
| South Americans | 39.6 /100 | #187 | Fair 89.5% |
| Immigrants | Nepal | 38.9 /100 | #188 | Fair 89.5% |
| Carpatho Rusyns | 37.8 /100 | #189 | Fair 89.5% |
| Shoshone | 37.5 /100 | #190 | Fair 89.5% |
| Immigrants | Poland | 37.1 /100 | #191 | Fair 89.5% |
| Immigrants | North Macedonia | 36.5 /100 | #192 | Fair 89.5% |