Comanche vs Cherokee 1 or more Vehicles in Household
COMPARE
Comanche
Cherokee
1 or more Vehicles in Household
1 or more Vehicles in Household Comparison
Comanche
Cherokee
89.9%
1 OR MORE VEHICLES IN HOUSEHOLD
63.4/ 100
METRIC RATING
164th/ 347
METRIC RANK
92.4%
1 OR MORE VEHICLES IN HOUSEHOLD
100.0/ 100
METRIC RATING
33rd/ 347
METRIC RANK
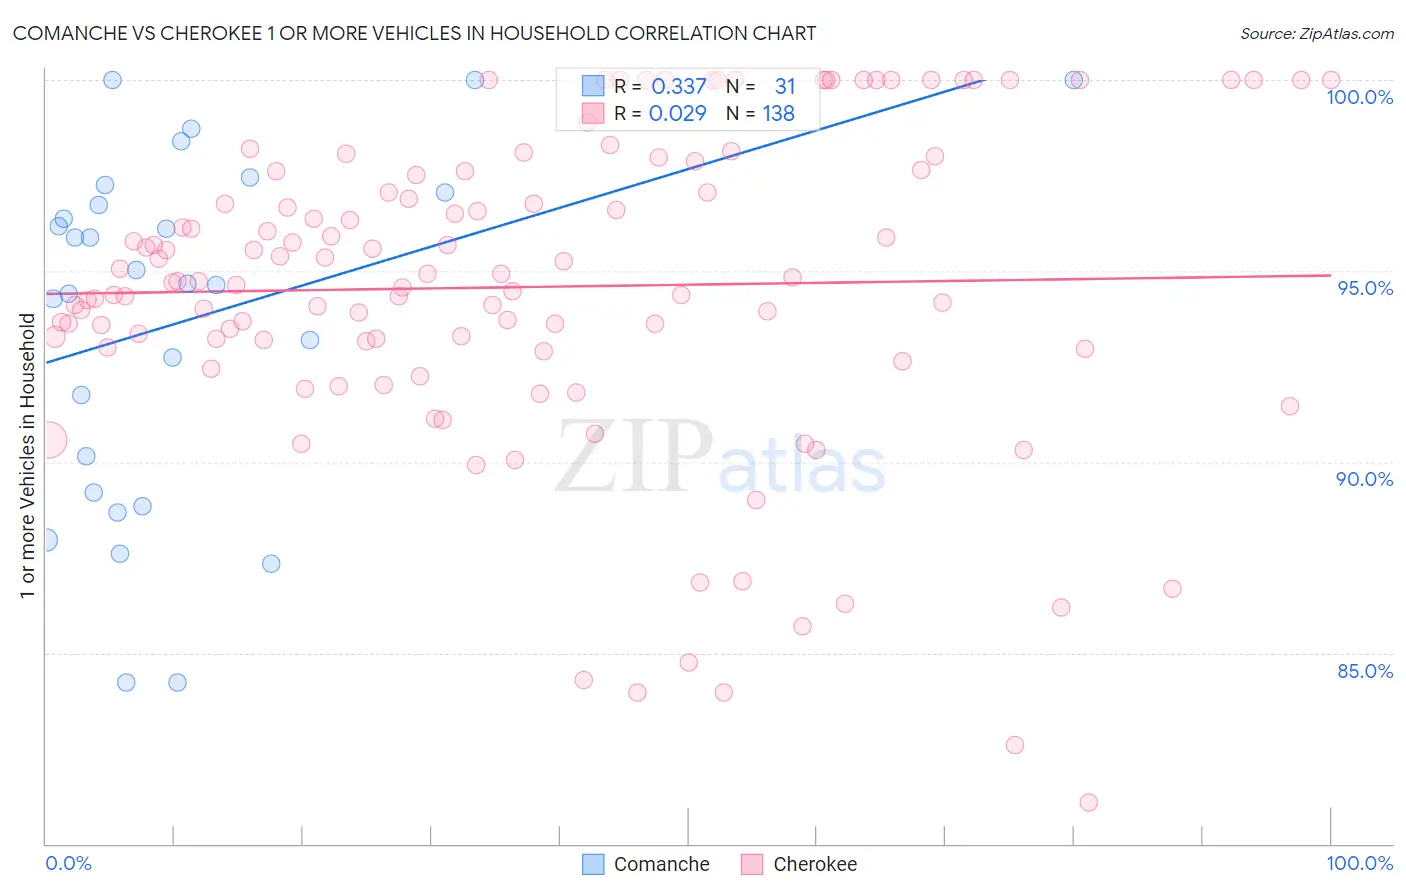
Comanche vs Cherokee 1 or more Vehicles in Household Correlation Chart
The statistical analysis conducted on geographies consisting of 109,768,112 people shows a mild positive correlation between the proportion of Comanche and percentage of households with 1 or more vehicles available in the United States with a correlation coefficient (R) of 0.337 and weighted average of 89.9%. Similarly, the statistical analysis conducted on geographies consisting of 493,431,899 people shows no correlation between the proportion of Cherokee and percentage of households with 1 or more vehicles available in the United States with a correlation coefficient (R) of 0.029 and weighted average of 92.4%, a difference of 2.8%.
1 or more Vehicles in Household Correlation Summary
| Measurement | Comanche | Cherokee |
| Minimum | 84.2% | 81.1% |
| Maximum | 100.0% | 100.0% |
| Range | 15.8% | 18.9% |
| Mean | 93.7% | 94.6% |
| Median | 94.7% | 94.7% |
| Interquartile 25% (IQ1) | 89.2% | 93.0% |
| Interquartile 75% (IQ3) | 97.1% | 97.6% |
| Interquartile Range (IQR) | 7.9% | 4.6% |
| Standard Deviation (Sample) | 4.6% | 4.1% |
| Standard Deviation (Population) | 4.5% | 4.1% |
Similar Demographics by 1 or more Vehicles in Household
Demographics Similar to Comanche by 1 or more Vehicles in Household
In terms of 1 or more vehicles in household, the demographic groups most similar to Comanche are Immigrants from Saudi Arabia (89.9%, a difference of 0.010%), Immigrants from Middle Africa (89.9%, a difference of 0.020%), Immigrants from Austria (89.9%, a difference of 0.040%), Immigrants from Latin America (89.8%, a difference of 0.050%), and Immigrants from Cambodia (89.8%, a difference of 0.050%).
| Demographics | Rating | Rank | 1 or more Vehicles in Household |
| Immigrants | Congo | 71.2 /100 | #157 | Good 90.0% |
| Brazilians | 71.0 /100 | #158 | Good 90.0% |
| South Africans | 69.7 /100 | #159 | Good 90.0% |
| Immigrants | Indonesia | 68.8 /100 | #160 | Good 90.0% |
| Salvadorans | 68.7 /100 | #161 | Good 90.0% |
| Spanish American Indians | 67.0 /100 | #162 | Good 89.9% |
| Immigrants | Austria | 65.5 /100 | #163 | Good 89.9% |
| Comanche | 63.4 /100 | #164 | Good 89.9% |
| Immigrants | Saudi Arabia | 62.6 /100 | #165 | Good 89.9% |
| Immigrants | Middle Africa | 62.2 /100 | #166 | Good 89.9% |
| Immigrants | Latin America | 60.3 /100 | #167 | Good 89.8% |
| Immigrants | Cambodia | 60.1 /100 | #168 | Good 89.8% |
| Natives/Alaskans | 59.5 /100 | #169 | Average 89.8% |
| Immigrants | Costa Rica | 57.6 /100 | #170 | Average 89.8% |
| French American Indians | 54.4 /100 | #171 | Average 89.8% |
Demographics Similar to Cherokee by 1 or more Vehicles in Household
In terms of 1 or more vehicles in household, the demographic groups most similar to Cherokee are Basque (92.4%, a difference of 0.010%), Samoan (92.4%, a difference of 0.050%), Native Hawaiian (92.4%, a difference of 0.060%), Finnish (92.4%, a difference of 0.060%), and Sri Lankan (92.5%, a difference of 0.070%).
| Demographics | Rating | Rank | 1 or more Vehicles in Household |
| British | 100.0 /100 | #26 | Exceptional 92.5% |
| Americans | 100.0 /100 | #27 | Exceptional 92.5% |
| Sri Lankans | 100.0 /100 | #28 | Exceptional 92.5% |
| Native Hawaiians | 100.0 /100 | #29 | Exceptional 92.4% |
| Finns | 100.0 /100 | #30 | Exceptional 92.4% |
| Samoans | 100.0 /100 | #31 | Exceptional 92.4% |
| Basques | 100.0 /100 | #32 | Exceptional 92.4% |
| Cherokee | 100.0 /100 | #33 | Exceptional 92.4% |
| Italians | 99.9 /100 | #34 | Exceptional 92.3% |
| Czechoslovakians | 99.9 /100 | #35 | Exceptional 92.3% |
| Malaysians | 99.9 /100 | #36 | Exceptional 92.3% |
| French Canadians | 99.9 /100 | #37 | Exceptional 92.3% |
| Immigrants | Vietnam | 99.9 /100 | #38 | Exceptional 92.3% |
| Swiss | 99.9 /100 | #39 | Exceptional 92.3% |
| Creek | 99.9 /100 | #40 | Exceptional 92.3% |