Chilean vs Puerto Rican No Vehicles in Household
COMPARE
Chilean
Puerto Rican
No Vehicles in Household
No Vehicles in Household Comparison
Chileans
Puerto Ricans
9.9%
NO VEHICLES IN HOUSEHOLD
81.2/ 100
METRIC RATING
143rd/ 347
METRIC RANK
15.5%
NO VEHICLES IN HOUSEHOLD
0.0/ 100
METRIC RATING
309th/ 347
METRIC RANK
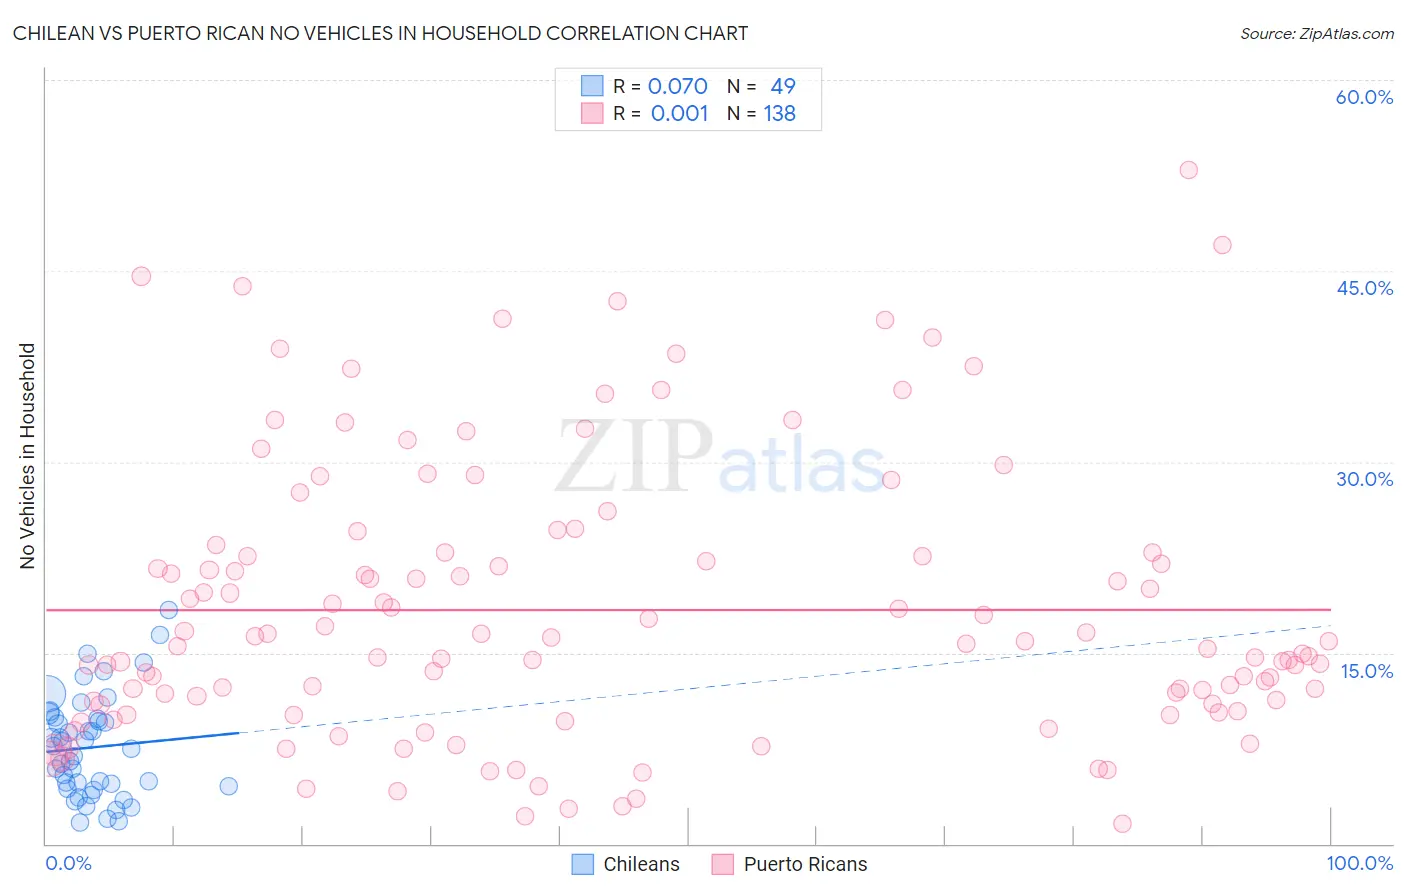
Chilean vs Puerto Rican No Vehicles in Household Correlation Chart
The statistical analysis conducted on geographies consisting of 256,325,892 people shows a slight positive correlation between the proportion of Chileans and percentage of households with no vehicle available in the United States with a correlation coefficient (R) of 0.070 and weighted average of 9.9%. Similarly, the statistical analysis conducted on geographies consisting of 525,427,776 people shows no correlation between the proportion of Puerto Ricans and percentage of households with no vehicle available in the United States with a correlation coefficient (R) of 0.001 and weighted average of 15.5%, a difference of 56.6%.
No Vehicles in Household Correlation Summary
| Measurement | Chilean | Puerto Rican |
| Minimum | 1.7% | 1.5% |
| Maximum | 18.4% | 53.0% |
| Range | 16.7% | 51.4% |
| Mean | 7.6% | 18.4% |
| Median | 7.5% | 15.6% |
| Interquartile 25% (IQ1) | 4.4% | 10.9% |
| Interquartile 75% (IQ3) | 9.9% | 22.8% |
| Interquartile Range (IQR) | 5.4% | 11.9% |
| Standard Deviation (Sample) | 4.0% | 10.8% |
| Standard Deviation (Population) | 3.9% | 10.8% |
Similar Demographics by No Vehicles in Household
Demographics Similar to Chileans by No Vehicles in Household
In terms of no vehicles in household, the demographic groups most similar to Chileans are Immigrants from Bahamas (9.9%, a difference of 0.0%), Bahamian (9.9%, a difference of 0.030%), Hungarian (9.9%, a difference of 0.26%), Immigrants from Nicaragua (9.9%, a difference of 0.31%), and Immigrants from Zimbabwe (9.9%, a difference of 0.35%).
| Demographics | Rating | Rank | No Vehicles in Household |
| Immigrants | South Africa | 85.0 /100 | #136 | Excellent 9.8% |
| Immigrants | Moldova | 84.6 /100 | #137 | Excellent 9.8% |
| Estonians | 84.2 /100 | #138 | Excellent 9.8% |
| Marshallese | 84.0 /100 | #139 | Excellent 9.8% |
| Immigrants | Lithuania | 84.0 /100 | #140 | Excellent 9.8% |
| Sudanese | 83.1 /100 | #141 | Excellent 9.8% |
| Immigrants | Zimbabwe | 82.6 /100 | #142 | Excellent 9.9% |
| Chileans | 81.2 /100 | #143 | Excellent 9.9% |
| Immigrants | Bahamas | 81.2 /100 | #144 | Excellent 9.9% |
| Bahamians | 81.0 /100 | #145 | Excellent 9.9% |
| Hungarians | 80.0 /100 | #146 | Excellent 9.9% |
| Immigrants | Nicaragua | 79.8 /100 | #147 | Good 9.9% |
| Immigrants | Bosnia and Herzegovina | 79.1 /100 | #148 | Good 9.9% |
| Immigrants | Uganda | 76.1 /100 | #149 | Good 10.0% |
| Colombians | 73.9 /100 | #150 | Good 10.0% |
Demographics Similar to Puerto Ricans by No Vehicles in Household
In terms of no vehicles in household, the demographic groups most similar to Puerto Ricans are Cape Verdean (15.6%, a difference of 0.56%), Immigrants from Israel (15.6%, a difference of 0.57%), U.S. Virgin Islander (15.4%, a difference of 0.65%), Immigrants from Haiti (15.4%, a difference of 0.69%), and Alaskan Athabascan (15.6%, a difference of 0.72%).
| Demographics | Rating | Rank | No Vehicles in Household |
| Haitians | 0.0 /100 | #302 | Tragic 14.9% |
| Immigrants | Western Africa | 0.0 /100 | #303 | Tragic 15.0% |
| Immigrants | Russia | 0.0 /100 | #304 | Tragic 15.1% |
| Immigrants | China | 0.0 /100 | #305 | Tragic 15.2% |
| Immigrants | Belize | 0.0 /100 | #306 | Tragic 15.4% |
| Immigrants | Haiti | 0.0 /100 | #307 | Tragic 15.4% |
| U.S. Virgin Islanders | 0.0 /100 | #308 | Tragic 15.4% |
| Puerto Ricans | 0.0 /100 | #309 | Tragic 15.5% |
| Cape Verdeans | 0.0 /100 | #310 | Tragic 15.6% |
| Immigrants | Israel | 0.0 /100 | #311 | Tragic 15.6% |
| Alaskan Athabascans | 0.0 /100 | #312 | Tragic 15.6% |
| Tohono O'odham | 0.0 /100 | #313 | Tragic 15.6% |
| Albanians | 0.0 /100 | #314 | Tragic 15.6% |
| Cypriots | 0.0 /100 | #315 | Tragic 15.7% |
| Ghanaians | 0.0 /100 | #316 | Tragic 16.4% |